

Consumer Insights
Uncover trends and behaviors shaping consumer choices today
Procurement Insights
Optimize your sourcing strategy with key market data
Industry Stats
Stay ahead with the latest trends and market analysis.

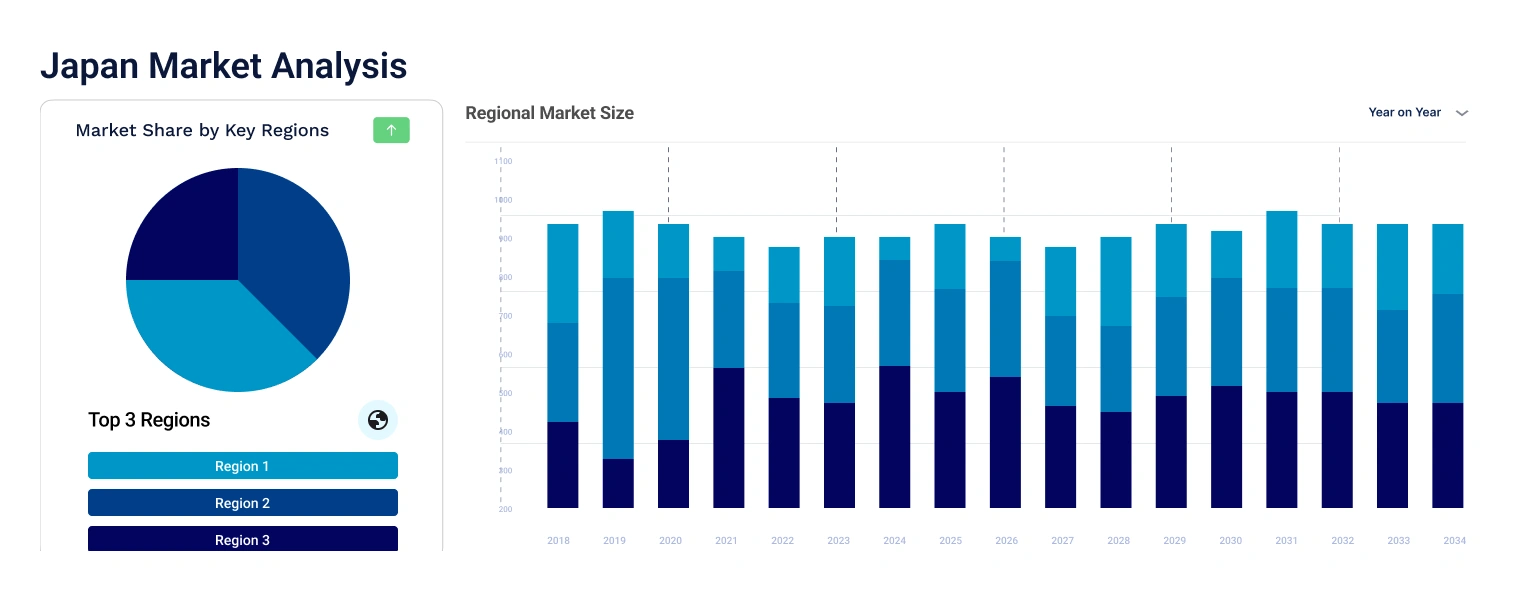
The Japan ice-cream market reached around USD 4.03 Billion in 2025. The market is projected to grow at a CAGR of 3.30% between 2026 and 2035, reaching almost USD 5.58 Billion by 2035.
Base Year
Historical Period
Forecast Period
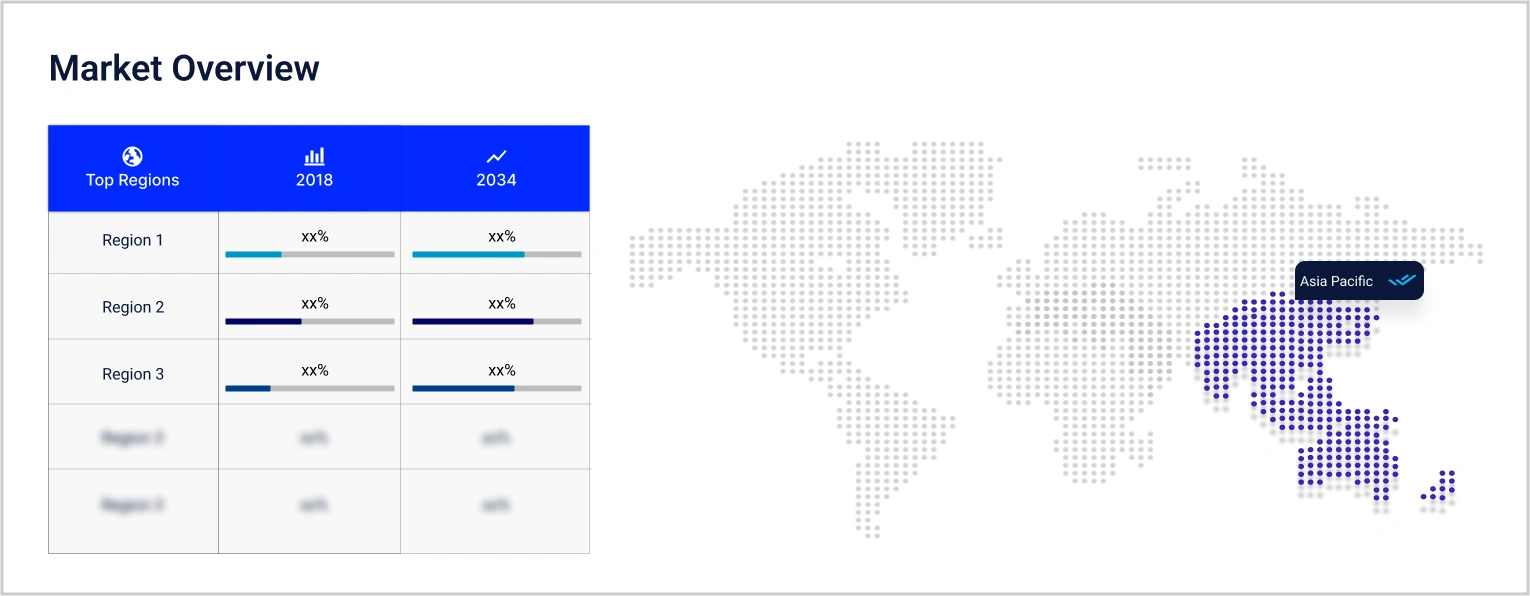
The Hokoriku region of Japan is amongst the leading ice-cream consuming regions in Japan.
The residents of Kanazawa on average spend 4,000 yen more than residents of Naha and Okinawa on ice-cream.
Meiji Holdings Co., Ltd. is a major market player, anticipated to control over 9% of the market share.
Compound Annual Growth Rate
3.3%
Value in USD Billion
2026-2035
*this image is indicative*
| Japan Ice-Cream Market Report Summary | Description | Value |
| Base Year | USD Billion | 2025 |
| Historical Period | USD Billion | 2019-2025 |
| Forecast Period | USD Billion | 2026-2035 |
| Market Size 2025 | USD Billion | 4.03 |
| Market Size 2035 | USD Billion | 5.58 |
| CAGR 2019-2025 | Percentage | XX% |
| CAGR 2026-2035 | Percentage | 3.30% |
| CAGR 2026-2035 - Market by Category | Artisanal Ice-Cream | 3.9% |
| CAGR 2026-2035 - Market by Category | Take-Home Ice-Cream | 3.1% |
| CAGR 2026-2035 - Market by Product Type | Cone | 3.8% |
| CAGR 2026-2035 - Market by End Use | Retailers | 3.7% |
| 2025 Market Share by Category | Impulse Ice-Cream | 38.2% |
The prefectures of Hokoriku region in Japan are among the leading ice-cream consuming regions in the market. On average, the residents of Ishikawa, Saga, and Fukui stock 7.2, 6.7, and 6.6 litres of ice-cream in their refrigerators, respectively. This is followed by Toyama (6 litres) and Nigata (5.9 litres).
As per the Ministry of Internal Affairs and Communications in Japan, the residents of Kanazawa in Ishikawa prefecture spent 12,146 yen on ice-creams, which is the highest amongst all ordinance designated and prefectural capital cities of Japan (52). The expenditure on ice-cream is also very high in other cities like Saitama (11,723 yen), Fukushima (11,267 yen), Yomagata (11,195 yen), and Yamamatsu(11,076 yen).
The sale of bite-size and sandwich-style ice-creams in Japan recorded a year-on-year growth of JPY 80 million in 2019. Cups and bars are the most popular format of ice-cream consumption in Japan. The sale of monaka style ice-creams surpassed those of ice-cream cones in 2019.
Ice-cream parlours which serve drinkable ice-creams are expected to become commonplace in Japan over the forecast period. The increasing demand for healthy ice-cream products is expected to prompt major companies to incorporate local salt and natural fruit juices into ice-creams to enhance their consumer appeal.
Japan Ice-Cream Market Report and Forecast 2026-2035 offers a detailed analysis of the market based on the following segments:
Market Breakup by Flavour
Market Breakup by Category
Market Breakup by Product Type
Market Breakup by End Use
Market Breakup by Distribution Channel
| CAGR 2026-2035 - Market by | Category |
| Artisanal Ice-Cream | 3.9% |
| Take-Home Ice-Cream | 3.1% |
| Impulse Ice-Cream | XX% |
| CAGR 2026-2035 - Market by | Product Type |
| Cone | 3.8% |
| Cup | 3.6% |
| Tub | 3.1% |
| Stick | XX% |
| Brick | XX% |
| Others | XX% |
| CAGR 2026-2035 - Market by | End Use |
| Retailers | 3.7% |
| Food Service | XX% |
Based on category, the market is divided into impulse ice-cream, take-home ice-cream, and artisanal ice-cream. Over the forecast period of 2026-2035, artisanal ice-cream is projected to grow at a CAGR of 3.9% during 2026-2035, driven by the rising demand for bold and innovative flavours of ice-cream.
| 2025 Market Share by | Category |
| Artisanal Ice-Cream | XX% |
| Impulse Ice-Cream | 38.2% |
| Take-Home Ice-Cream | XX% |
Major market players like Cellato are experimenting with unique and rare European ingredients like white truffles and sake lees in Japanese ice-creams to provide a savoury experience to ice-creams. Such ice-creams are highly priced and are expected to gain popularity among consumers seeking premium products.


Upto 15% Off
USD
$2499 $2249
$3999 $3599
$4999 $4249
$5999 $5099


*While we strive to always give you current and accurate information, the numbers depicted on the website are indicative and may differ from the actual numbers in the main report. At Expert Market Research, we aim to bring you the latest insights and trends in the market. Using our analyses and forecasts, stakeholders can understand the market dynamics, navigate challenges, and capitalize on opportunities to make data-driven strategic decisions.*
Get in touch with us for a customized solution tailored to your unique requirements and save upto 35%!
The market reached nearly USD 4.03 Billion in 2025.
The market is projected to grow at a CAGR of 3.30% between 2026 and 2035.
The market is assessed to witness a healthy growth in the forecast period to reach around USD 5.58 Billion in 2035.
The different ice-cream flavours in the market include chocolate, fruit, and vanilla, among others.
The different categories of ice-creams in the market include impulse ice-cream, take-home ice-cream, and artisanal ice-cream.
The different product types in the market include cup, stick, cone, brick, and tub, among others.
The various distribution channels for ice-cream in Japan include hypermarkets/supermarkets, HoReCa, convenience stores, and online channel, among others.
The key market players are Meiji Holdings Co., Ltd., MORINAGA MILK INDUSTRY CO.,LTD., Lotte CO., LTD., NISSEI Co.,Ltd., Häagen-Dazs Japan, Incorporated, Akagi Nyugyo Co., Ltd., IMURAYA GROUP CO., LTD., and Morinaga Co., Ltd., among others.
Explore our key highlights of the report and gain a concise overview of key findings, trends, and actionable insights that will empower your strategic decisions.
| REPORT FEATURES | DETAILS |
| Base Year | 2025 |
| Historical Period | 2019-2025 |
| Forecast Period | 2026-2035 |
| Scope of the Report |
Historical and Forecast Trends, Industry Drivers and Constraints, Historical and Forecast Market Analysis by Segment:
|
| Breakup by Flavour |
|
| Breakup by Category |
|
| Breakup by Product Type |
|
| Breakup by End Use |
|
| Breakup by Distribution Channel |
|
| Market Dynamics |
|
| Competitive Landscape |
|
| Companies Covered |
|
Datasheet
One User
USD 2,499
USD 2,249
tax inclusive*
Single User License
One User
USD 3,999
USD 3,599
tax inclusive*
Five User License
Five User
USD 4,999
USD 4,249
tax inclusive*
Corporate License
Unlimited Users
USD 5,999
USD 5,099
tax inclusive*
*Please note that the prices mentioned below are starting prices for each bundle type. Kindly contact our team for further details.*
Flash Bundle
Small Business Bundle
Growth Bundle
Enterprise Bundle
*Please note that the prices mentioned below are starting prices for each bundle type. Kindly contact our team for further details.*
Flash Bundle
Number of Reports: 3
20%
tax inclusive*
Small Business Bundle
Number of Reports: 5
25%
tax inclusive*
Growth Bundle
Number of Reports: 8
30%
tax inclusive*
Enterprise Bundle
Number of Reports: 10
35%
tax inclusive*
How To Order

Select License Type
Choose the right license for your needs and access rights.

Click on ‘Buy Now’
Add the report to your cart with one click and proceed to register.

Select Mode of Payment
Choose a payment option for a secure checkout. You will be redirected accordingly.
Gain insights to stay ahead and seize opportunities.

Get insights & trends for a competitive edge.

Track prices with detailed trend reports.

Analyse trade data for supply chain insights.

Leverage cost reports for smart savings

Enhance supply chain with partnerships.

Connect For More Information
Our expert team of analysts will offer full support and resolve any queries regarding the report, before and after the purchase.
Our expert team of analysts will offer full support and resolve any queries regarding the report, before and after the purchase.
We employ meticulous research methods, blending advanced analytics and expert insights to deliver accurate, actionable industry intelligence, staying ahead of competitors.
Our skilled analysts offer unparalleled competitive advantage with detailed insights on current and emerging markets, ensuring your strategic edge.
We offer an in-depth yet simplified presentation of industry insights and analysis to meet your specific requirements effectively.


Share