

Consumer Insights
Uncover trends and behaviors shaping consumer choices today
Procurement Insights
Optimize your sourcing strategy with key market data
Industry Stats
Stay ahead with the latest trends and market analysis.

The Japan e-commerce market reached approximately USD 131.95 Billion in 2025. The market is projected to grow at a CAGR of 7.10% between 2026 and 2035, reaching a value of around USD 262.00 Billion by 2035.
Base Year
Historical Period
Forecast Period
As per industry reports, the average monthly online expenditure per household in Japan is USD 136.
In Japan, about 45.9% of people purchase goods on the internet.
In 2023, the population of Japan reached 123,294,513 people, constituting about 1.53% of the global population. The rising population creates a demand for consumer goods, impacting the growth of e-commerce.
Compound Annual Growth Rate
7.1%
Value in USD Billion
2026-2035
*this image is indicative*
| Japan E-Commerce Market Report Summary | Description | Value |
| Base Year | USD Billion | 2025 |
| Historical Period | USD Billion | 2019-2025 |
| Forecast Period | USD Billion | 2026-2035 |
| Market Size 2025 | USD Billion | 131.95 |
| Market Size 2035 | USD Billion | 262.00 |
| CAGR 2019-2025 | Percentage | XX% |
| CAGR 2026-2035 | Percentage | 7.10% |
| CAGR 2026-2035 - Market by Type | Business to Consumer (B2C) | 8.9% |
| CAGR 2026-2035 - Market by Industry | Consumer Electronics | 8.1% |
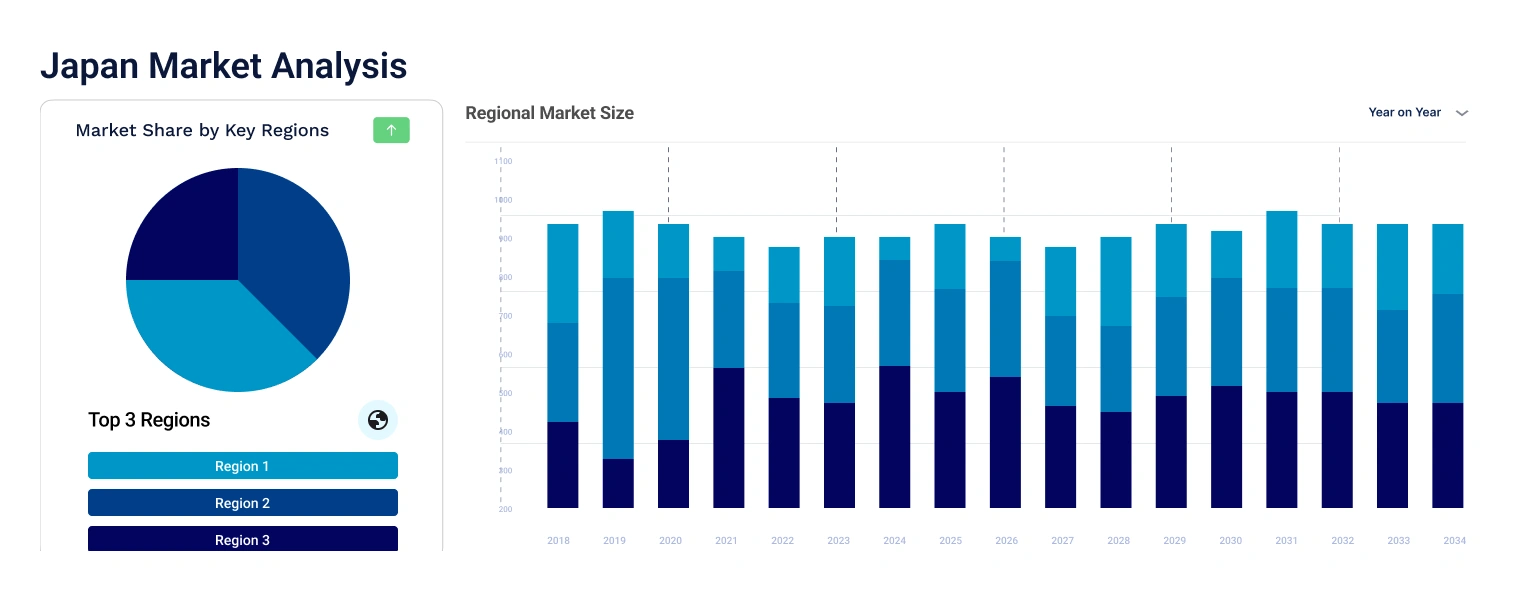
Japan is the third-largest economy globally, with a GDP of USD 5 trillion. In 2021, GDP per capita reached 42,927. Japan has the presence of one of the most developed and growing e-commerce markets on a global scale. The added convenience of online shopping, with its 24/7 availability and doorstep delivery, is a key factor in its increased adoption among time-conscious Japanese consumers who value efficiency.
The major products purchased through online channels by Japanese consumers are fashion products, consumer electronics, phones and accessories, baby products, and electronic gadgets. In 2021, the total spending on food and personal care through e-commerce in Japan amounted to USD 25.77 billion, while fashion and beauty, and electronics and physical media amounted to USD 23.93 billion, and USD 18.90 billion, respectively.
Most of the market is divided between Amazon Japan, accounting for 49.6%, and Rakuten, holding 32.4% of the market share. Amazon has over 20 fulfillment centres and its additional Amazon delivery centres ensures smooth and efficient delivery services. Amazon Japan's top-selling items encompass soaps, cosmetics, and luxury umbrellas.
"Japan E-Commerce Market Report and Forecast 2026-2035" offers a detailed analysis of the market based on the following segments:
Market Breakup by Type
Market Breakup by Industry
| CAGR 2026-2035 - Market by | Type |
| Business to Consumer (B2C) | 8.9% |
| Business to Business (B2B | XX% |
| CAGR 2026-2035 - Market by | Industry |
| Consumer Electronics | 8.1% |
| Food and Beverage | 7.6% |
| Beauty and Personal Care | XX% |
| Fashion and Apparel | XX% |
| Health and Wellness | XX% |
| Others | XX% |
The government of Japan has set goals to raise the number of consumers using cashless settlements to 40% by 2025. The goal is part of the country’s “Cashless Vision”, which aims to improve the use of application programming interfaces (API) among credit card companies. The trend of cashless transactions in Japan is further supporting the growth of the e-commerce market in Japan.
Market players are actively conducting their business activities in accordance with government regulations and competition policy, to ensure transparency in their operations


Upto 15% Off
USD
$2499 $2249
$3999 $3599
$4999 $4249
$5999 $5099


*While we strive to always give you current and accurate information, the numbers depicted on the website are indicative and may differ from the actual numbers in the main report. At Expert Market Research, we aim to bring you the latest insights and trends in the market. Using our analyses and forecasts, stakeholders can understand the market dynamics, navigate challenges, and capitalize on opportunities to make data-driven strategic decisions.*
Get in touch with us for a customized solution tailored to your unique requirements and save upto 35%!
In 2025, the market reached an approximate value of USD 131.95 Billion.
The Japan e-commerce market is projected to grow at a CAGR of 7.10% between 2026 and 2035.
The market is estimated to witness healthy growth during 2026-2035 and to reach around USD 262.00 Billion by 2035.
The growth of the e-commerce sector in Japan is primarily fuelled by Japan's high internet penetration and advanced network infrastructure, influence of social media platforms, and increasing adoption of e-commerce by older consumers.
Business to Consumer (B2C) and Business to Business (B2B) are the two types of e-commerce.
The major industries include beauty and personal care, fashion and apparel, consumer electronics, food and beverage, health and wellness, home décor, and household consumables, among others.
The major players in the market are Rakuten Group, Inc, Yahoo Japan Corporation, Amazon.com, Inc, Apple Inc, Mercari, Inc, DMM.com, ZOZO Co., Ltd, and KDDI/au Commerce & Life, Inc., among others.
Explore our key highlights of the report and gain a concise overview of key findings, trends, and actionable insights that will empower your strategic decisions.
| REPORT FEATURES | DETAILS |
| Base Year | 2025 |
| Historical Period | 2019-2025 |
| Forecast Period | 2026-2035 |
| Scope of the Report |
Historical and Forecast Trends, Industry Drivers and Constraints, Historical and Forecast Market Analysis by Segment:
|
| Breakup by Type |
|
| Breakup by Industry |
|
| Market Dynamics |
|
| Competitive Landscape |
|
| Companies Covered |
|
Datasheet
One User
USD 2,499
USD 2,249
tax inclusive*
Single User License
One User
USD 3,999
USD 3,599
tax inclusive*
Five User License
Five User
USD 4,999
USD 4,249
tax inclusive*
Corporate License
Unlimited Users
USD 5,999
USD 5,099
tax inclusive*
*Please note that the prices mentioned below are starting prices for each bundle type. Kindly contact our team for further details.*
Flash Bundle
Small Business Bundle
Growth Bundle
Enterprise Bundle
*Please note that the prices mentioned below are starting prices for each bundle type. Kindly contact our team for further details.*
Flash Bundle
Number of Reports: 3
20%
tax inclusive*
Small Business Bundle
Number of Reports: 5
25%
tax inclusive*
Growth Bundle
Number of Reports: 8
30%
tax inclusive*
Enterprise Bundle
Number of Reports: 10
35%
tax inclusive*
How To Order

Select License Type
Choose the right license for your needs and access rights.

Click on ‘Buy Now’
Add the report to your cart with one click and proceed to register.

Select Mode of Payment
Choose a payment option for a secure checkout. You will be redirected accordingly.
Gain insights to stay ahead and seize opportunities.

Get insights & trends for a competitive edge.

Track prices with detailed trend reports.

Analyse trade data for supply chain insights.

Leverage cost reports for smart savings

Enhance supply chain with partnerships.

Connect For More Information
Our expert team of analysts will offer full support and resolve any queries regarding the report, before and after the purchase.
Our expert team of analysts will offer full support and resolve any queries regarding the report, before and after the purchase.
We employ meticulous research methods, blending advanced analytics and expert insights to deliver accurate, actionable industry intelligence, staying ahead of competitors.
Our skilled analysts offer unparalleled competitive advantage with detailed insights on current and emerging markets, ensuring your strategic edge.
We offer an in-depth yet simplified presentation of industry insights and analysis to meet your specific requirements effectively.


Share