

Consumer Insights
Uncover trends and behaviors shaping consumer choices today
Procurement Insights
Optimize your sourcing strategy with key market data
Industry Stats
Stay ahead with the latest trends and market analysis.
Trending Now


The global ISO tank container market attained a value of USD 789.92 Million in 2024. The market is expected to grow at an estimated CAGR of 4.96% during 2025 to 2034. By 2034, global ISO tank container market is expected to reach a value of USD 1281.80 Million. The increasing need for temperature-controlled transportation of pharmaceuticals to ensure the highest level of product purity drives the demand for ISO tank containers.
Base Year
Historical Year
Forecast Year
ISO tank containers are designed to combat product spillage and leakage, save fuel and reduce carbon dioxide emissions by up to 70%. They are widely deployed in the transportation of chemicals, pharmaceuticals, oil and gas. By 2027, global LNG exports are expected to reach 56 bcm per year from 12 bcm per year in 2023.
Most standard size ISO container tanks have a capacity of around 21,000 litres to 27,000 litres and usually come with a dimension of 20′ x 8′ x 8.6′. For greater capacity requirements, tanks with extended lengths beyond the standard frame, known as Swap Bodies, offer capacities ranging from 29,000 to 35,000 litres.
LNG and CNG gases can be safely transported through ISO tanks. In 2024, global LNG exports were 38 bcm/year.


Value in USD Million
2025-2034
ISO Tank Container Market Outlook
*this image is indicative*
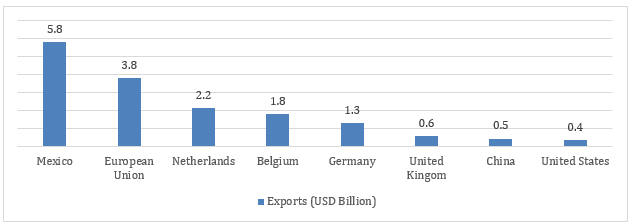
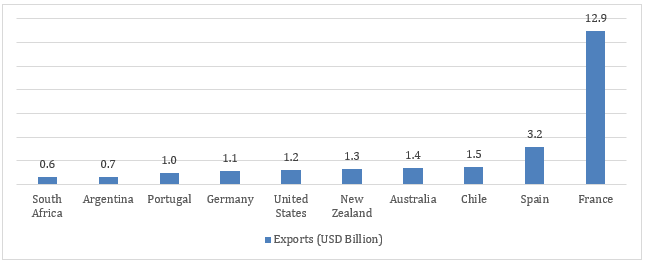
The growing demand for food grade liquids such as juices and wines support the growth of ISO tank container market. In 2023, France was the leading country globally in exporting wine with an export value of USD 12.9 billion, followed by Spain with 3.2 billion. Similarly, in 2023, Mexico was the leading exporter of beer with a revenue of USD 5.8 billion, followed by European Union with 3.8 billion. In 2023, in Europe, Belgium was the leading beer exporter (intra-EU and extra-EU) with an overall export of 15,004 thousand HL, followed by Germany with 14,326 thousand HL and the Netherlands with 12,684 thousand HL.
Figure: Global Beer Exports (USD Billion) by Top Countries, 2023
ISO tank containers come in standard sizes, typically 20 feet and 40 feet, making them suitable for intermodal transportation.
Most standard ISO tank containers follow the T11 T code. This makes them suitable for food-grade, unclassified, and some classified products. For more demanding products like acids, companies can upgrade the T11 container to a T14 model. The T14 is stronger and more durable, making it better for hazardous liquid.
Each container must meet important international standards like ISO, CSC, TIR, UIC, and UN Portable Tank codes (including US-DOT, IMDG, and ADR 6.7). Many containers also have dual certification, such as ADR TANK 6.8 (like L4BN), which ensures the legal and safety requirements. ISO tank containers are also certified to American (ASI, ASME, ANSI, AISC, AVI, ASCE, IBC, UBC, NEMA), European (Euro, PED, TEMA), and Indian (BIS, ISI) standards.
Figure: Global Wine Exports (USD Billion) by Top 10 Countries, 2023
Tank production is largely concentrated in China where there are several manufacturers building tanks for the international and domestic market. Tanks are also manufactured in South Africa and Europe. CIMC Safeway Technologies Co. Ltd, China is a clear leader in the global ISO tank market, commanding an impressive 50.1% market share in 2022.
ISO tank containers are widely used for chemical transportation as they are designed to safely handle hazardous liquids repeatedly. In 2022, China accounted for 18.4% of total chemical exports.


The growth in international trade aids the demand for ISO tanks for transporting chemical, petrochemical and food-grade liquids. In volume terms, world merchandise trade increased by 2.7% in 2022. ISO tank containers maximise space, allowing higher chemical volumes per container and reducing chemical handling risk by eliminating intermediate handling. In 2022, global chemical exports grew by 18.6% compared to 2021 and China accounted for 18.4% of the total chemical exports, followed by the United States with 8.8% share.
As per the ISO tank container market report, in 2024, there were over 240 operators of tank container globally, ranging from very large global companies to relatively small niche and regional players.
According to January 2024 data, the top ten operators accounted for over 297,955 tanks representing over 50% of the global tank container operators’ fleet, accounting for 587,970 tanks. According to January 2024 data, the top 10 lessors accounted for 317,740 tanks, representing about 85% of the total leasing fleet (372,195 tanks).
Technological advances, sustainable logistics, and the expansion of petrochemical sector drive ISO tank container market growth.
As ISO tank containers are 90% recyclable, they are highly sustainable compared to other transportation materials. Further, as they serve as their own packaging, ISO tank containers eliminate the need for additional materials, reducing complexity and costs. The International Maritime Organization (IMO) has set a CO2 reduction target of at least 40% for international shipping by 2030, with aims to reach 70% by 2050, compared to 2008 levels.
ISO tank containers exhibit enhanced safety features such as pressure relief valves, vapour valves, burst discs, and thermometers to measure pressure and temperature of the external shell. As a result, petrochemical products such as diesel, liquids, and gases can be safely transported using these tanks, supporting the ISO tank container market development. In 2022, 98 countries produced approximately 80.75 million barrels of crude oil, with five of them contributing to around 52% of the total output. Products such as liquefied natural gas (LNG), industrial gasses like oxygen and nitrogen, and compressed natural gas (CNG) can be safely transported in ISO tank containers.
ISO tank containers are commonly used for transporting chemicals and are thoroughly cleaned in a controlled and monitored process to ensure safe handling of hazardous liquids. Global chemical production is expected to expand by 3.5% in 2025 compared to 2024. Leading chemical companies in the world include BASF SE, Dow Chemical Company, LyondellBasell Industries N.V, and Mitsubishi Chemical Group Corporation.
ISO tank containers are certified by the International Organization for Standardization (ISO). The certification ensures that the tank meets the requirements for structural integrity, leak prevention, pressure testing, and compatibility with various modes of transport. Additionally, ISO tank containers feature standardised dimensions and fittings, enabling them to be easily loaded, unloaded, stacked, and transported using standard container-handling equipment.
ISO tank containers are designed for durability, with a service life that exceeds 20 years, making them a long-term investment for liquid cargo transportation. These containers are approximately 90% recyclable, highlighting their eco-friendly nature.
Smart ISO tank containers: The integration of IoT technologies has revolutionized the ISO tank container market, enhancing real-time tracking, temperature monitoring, and security, which improves operational efficiency and cargo safety across industries.
Green Technologies: The industry is increasingly adopting eco-friendly solutions, such as electric-powered refrigeration units, solar panels, and lightweight materials, to reduce emissions and improve energy efficiency during transportation.
In chemical transportation, ISO tank containers offer enhanced safety features, including pressure relief valves and emergency vents, ensuring efficient chemical handling. ISO tank containers are classified using the 'T Code System’ which identifies the containers based on the cargo they carry. While T11 indicates ISO tanks carrying non-hazardous chemicals, such as caustic soda, T14 code indicates tanks carrying hazardous chemicals. In 2023, China accounted for 17.6% of the total organic chemical exports, followed by the United States and Ireland with 11.7% share and 10.1% share, respectively.
ISO tank containers offer a standardised and versatile solution for intermodal transport. As a result, these are increasingly adopted in global trade. Furthermore, ISO tanks are required in the transportation of liquid food grade solutions for enhanced safety, which is significantly supporting the ISO tank container market. In 2023, the United States dairy exports amounted to USD 8 billion with a total volume of 2.63 million metric tons.
Since ISO tank containers have been designed, manufactured, and tested to comply with internationally recognised safety and performance standards, their upfront cost is generally high. The significant cost may be a barrier for small businesses or those new to the logistics market, thus hindering the ISO tank container market growth.
ISO tanks require proper maintenance to guarantee the safe transport of cargo. Failure to maintain ISO tank containers can cause leaks, structural damage, or cargo contamination, which may lead to accidents or significant financial losses. Additionally, cleaning of ISO tank containers and parts replacement is a complex and capital-intensive procedure.
Read more about this report - REQUEST FREE SAMPLE COPY IN PDF
“ISO Tank Container Market Report and Forecast 2025-2034” offers a detailed analysis of the market based on the following segments:
On the basis of transport mode, the market can be divided into the following:
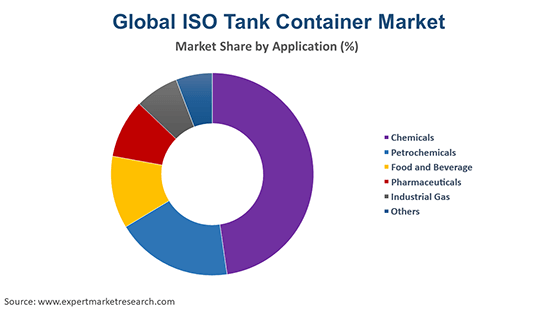
On the basis of application, the market can be divided into the following:
Based on region, the market can be segregated into:
Tank containers are crucial for the transportation of various liquids:
Tank containers transport diverse cargo, including gases, powders, liquids, hazardous and non-hazardous materials, and perishable and non-perishable food products like orange juice, wine, and liquid chocolate. As per July 2024 reports, Brazil is the largest producer of orange juice and exports around 75% of orange juice, globally.
As per the ISO tank container market analysis, in 2022, France, Italy, Spain, Chile, and Australia emerged as the top five wine exporters. Together, these countries accounted for 70.5% of global wine exports by value.
Significant use of ISO tanks for transportation of goods via roads:
According to 2024 report, the United States has the largest road network globally at 6.6 million kilometres, followed by India with 6.4 million kilometres and China with 5.2 million kilometres.
In 2023, road transportation in Europe saw a notable share, covering 24.1% of EU exports and 18.7% of imports.
Rising use of ISO tank for LNG transportation:
Together, the United States, Australia, and Qatar—the three largest global LNG exporters made up 60% of total LNG exports in 2023. Global liquefied natural gas (LNG) trade reached a record high in 2022, averaging 51.7 billion cubic feet per day (Bcf/d).
ISO containers are made of stainless steel and coated with a plastic layer. They are designed to transport both hazardous and non-hazardous petrochemicals in bulk. In 2022, top three crude oil producing countries were United States, Saudi Arabia, and Russia with a production of 756, 598, and 544 million tonnes of crude oil respectively. Some of the leading petrochemical manufacturers are Saudi Arabian Oil Co., China Petrochemical Corporation, Exxon Mobil Corporation, TotalEnergies SE, Chevron Corporation and Shell plc, among others.
The chemical industry increasingly relies on ISO tank containers for cost-efficient transport, enabling seamless intermodal transfers, reducing transhipment complexities, and eliminating packaging costs with their secure, ready-to-load design, thus positively impacting the ISO tank container market. The top five exporters of organic and inorganic chemicals, namely, China, the United States, Ireland, Switzerland, and Germany, accounted for 44.5% of global chemical exports in 2023.
Industrial gasses such as oxygen helium, and nitrogen can be safely and easily transported via specially designed ISO tank containers.
Some of the leading suppliers of oxygen and liquid nitrogen include Air Liquide, Air Products and Chemicals, Inc., Linde plc, and Taiyo Nippon Sanso Corporation, among others.
In 2023, Brothers Gas, a gas company in the Middle East awarded a contract to build Helium ISO tanks. Brothers Gas plans to invest USD 25 million into the helium business, which will be used for purchasing ISO tanks, helium dewars, transfill facilities, and other related activities.
North America ISO Tank Container Market Opportunities
In 2023, food and beverage production sector contributed over USD 534.3 billion of GDP. The expanding food and beverage industry has increased the need for ISO tank containers to transport edible liquids like oils, syrups, and wine.
According to Agriculture Canada, in 2022, the food and beverage processing industry ranked as the largest manufacturing industry by value, accounting for 1.7% of the national GDP.
As per the ISO tank container market analysis, in 2022, exports of processed food and beverage products stood at USD 54.3 billion, a rise of 14.1% over 2021, and accounted for 7% of Canada’s total exports. ISO tanks are suitable for transporting food-grade liquids, such as edible oils, juices, ensuring their freshness and quality throughout the supply chain.
In 2023, crude oil production in the United States, including condensate, reached an average of 12.9 million barrels per day (b/d), surpassing the previous U.S. and global record of 12.3 million b/d set in 2019.
As per 2022 records, the U.S. chemical sector distributes over 70,000 diverse products to more than 750,000 end users throughout the country. Additionally, as per 2022 records, the chemical sector is deemed the largest exporting sector representing more than 9% of the US exports.
Europe ISO Tank Container Market Dynamics
The Europe ISO tank container market is expanding due to rising environmental concerns. Under the Paris Agreement, companies must cut carbon emissions by 55% by 2030 compared to 1990 levels to meet climate targets. ISO tank containers reduce up to 50% of carbon footprints on long-haul routes, increasing their adoption by logistics companies.
In 2023, the total oil supply in Germany was recorded at 3,502,604 TJ, Also, in 2023, the total crude oil production in Germany was recorded at 1,14,526 TJ.
Germany is the leading beer producer in Europe, with production reaching over 87.8 million hectolitres in 2022. ISO tanks are designed to securely store and transport liquids and gasses, minimising the risk of leaks and spills during transit, making it a suitable option for the petrochemical and beer sector.
Asia Pacific ISO Tank Container Market Trends
Countries such as China and India are key markets for chemicals and petrochemical production and export. In 2022, China accounted for 44% of global chemical production, underscoring the need for reliable and efficient transport solutions such as ISO tank containers.
The belt and road initiative put forward by China to promote economic development and inter-regional connectivity in over 115 countries is creating greater opportunities for ISO tank containers due to its flexible transportation method, high safety and environmental protection characteristics.
Some of the ISO tank container companies in China are NANTONG TANK CONTAINER CO., LTD (NTtank), Hubei Qixing Group and Shanghai Pacific International Container Co., Ltd. (SPIC).
As per 2024 records, India is considered the 6th largest chemical producer in the world and 3rd in Asia, contributing 7% to India’s GDP. In 2024, the Indian chemicals sector was valued at USD 220 billion and is expected to reach USD 300 billion by 2030 and USD 1 trillion by 2040.
During FY25 (April-September), import of chemicals is expected to reach USD 15,021.0 million, while exports are expected to reach USD 10,569.1 million. The expansion of production and trade activities in the chemical sector is pushing the ISO tank container market growth.
Latin America ISO Tank Container Market Insights
As per 2024 data, the region handles 7% of global maritime trade. In 2023, key ports like Santos (4,284k TEU throughput) in Brazil, Manzanillo (3,699k TEU throughput) in Mexico Pacific and Cartagena Bay (3,299k TEU throughput) in Colombia were some of the busiest ports in the region.
Brazil has a strong chemical industry, comprising four major petrochemical complexes and 984 industrial chemical plants. In 2023, the industry achieved USD 167.4 billion in net sales.
Some of the leading ISO tank container operators in the country include Stolt-Nielsen Afretamento Brazil Ltda, M&S Logistics, and NewPort.
In 2023, Mexico's chemical industry contributed around 1.3% to the country's GDP.
In 2023, chemical production reached USD 21.4 billion, with imports totaling USD 43.9 billion. Petrochemicals held the largest share, accounting for 22.2% of total chemical sales.
Middle East and Africa ISO Tank Container Market Drivers
Leading ports in 2023, such as Jebel Ali (13.97M TEU), Tanger Med (7.59M TEU), Jeddah (4.96M TEU), and Salalah (4.50M TEU) are located along key trade routes like the Suez Canal and Strait of Hormuz, ensuring efficient chemical transport.
According to 2023 data by the International Trade Administration, the UAE is among the world’s ten largest oil producers, with approximately 100 billion barrels of proven oil reserves, 96% of which are in Abu Dhabi. The UAE produces an average of 3.2 million barrels of petroleum and liquids per day. Abu Dhabi National Oil Company (ADNOC), a global leader in the industry, plans to increase its maximum sustainable production capacity to 5 million barrels by 2030, which will likely support the ISO tank container market.
As per 2024 data, Saudi Arabia contributes 10% in the global chemical trade. The Kingdom’s USD 600 billion petrochemical investment by 2030 aims to enhance downstream production and specialty chemical capacities.
According to the 2024 report, the country holds 17% of the world's identified petroleum reserves and is focusing on high-value downstream chemical exports.
The incorporation of smart technologies, such as ISO tank containers equipped with sensors and tracking systems, boosts visibility, facilitates real-time cargo condition monitoring, and streamlines logistics operations. The expansion of industrial IoT necessitates the adoption of ISO tank containers. Companies such as DeleeTech, OrgPal, and Rugged Telemetry develop remote monitoring and sensing solutions for ISO tanks.
Founded in 2022, CIMC Safeway Technologies Co., Ltd. is a wholly-owned subsidiary of CIMC Enric Holdings Limited, which operates under the China International Marine Containers (Group) Co., Ltd. CIMC Safeway specialises in designing and delivering a wide range of tank containers, including standard, specialised, and customised solutions, available in both beam and collar frame configurations.
Founded in 2000, Danteco Industries BV specialises in designing and manufacturing of ISO tanks for transporting liquid and powder cargoes, Including sales, leasing, and purchase. The company supplies ISO tanks for bitumen, asphalt, cement, limestone, heavy crudes, chemicals, and other bulk materials.
Founded in 2018 and headquartered in China, Jingjiang Yatai Logistics Equipment Co., Ltd., known as "Yatai Container," is a professional enterprise specialising in the design, research and development, production, manufacturing, and maintenance of tank containers.
Founded in 1988, Singamas Container Holdings Limited is a prominent container manufacturer and logistics service provider in the Asia-Pacific region. The company operates five factories in China, producing dry freight, tank, and customized containers.
*Please note that this is only a partial list; the complete list of key players is available in the full report. Additionally, the list of key players can be customized to better suit your needs.*
Other key players in the ISO tank container market are Welfit Oddy (Pty) Ltd., Stolt-Nielsen Limited, HOYER GmbH, Bertschi AG, and Bulkhaul Ltd., among others.
ISO Tank Container Market Size
*While we strive to always give you current and accurate information, the numbers depicted on the website are indicative and may differ from the actual numbers in the main report. At Expert Market Research, we aim to bring you the latest insights and trends in the market. Using our analyses and forecasts, stakeholders can understand the market dynamics, navigate challenges, and capitalize on opportunities to make data-driven strategic decisions.*
Get in touch with us for a customized solution tailored to your unique requirements and save upto 35%!
The ISO tank container market is estimated to witness healthy growth in the forecast period of 2025-2034 to reach a value of around USD 1281.80 Million by 2034.
The major drivers of the market are the rising usage of petrochemicals in various end-use sectors, the rising demand for ISO tank containers in developing countries, and the high corrosion resistance and strength offered by ISO tank containers.
The expanding maritime trading, the increasing manufacturing of ISO tank containers, and the capacity and durability offered by ISO tank containers are the key trends guiding the market growth.
The major regions in the market are North America, Europe, the Asia Pacific, Latin America, and the Middle East and Africa.
The different applications of ISO tank containers include chemicals, petrochemicals, food and beverage, pharmaceuticals, and industrial gas, among others.
The various transport modes of ISO tank containers are road, rail, and marine.
An ISO container refers to a standardised intermodal freight container designed and built in accordance with the specifications set by the International Organization for Standardization (ISO).
The major players in the market are CIMC Safeway Technologies Co., Ltd., Danteco Industries BV, Jingjiang Yatai Logistics Equipment Co. Ltd, Singamas Container Holdings Limited, Welfit Oddy (Pty) Ltd., Stolt-Nielsen Limited, HOYER GmbH, Bertschi AG, and Bulkhaul Ltd., among others.
In 2024, the ISO tank container market reached an approximate value of USD 789.92 Million.
The market is assessed to grow at a CAGR of 4.96% between 2025 and 2034.
Explore our key highlights of the report and gain a concise overview of key findings, trends, and actionable insights that will empower your strategic decisions.
| REPORT FEATURES | DETAILS |
| Base Year | 2024 |
| Historical Period | 2018-2024 |
| Forecast Period | 2025-2034 |
| Scope of the Report |
Historical and Forecast Trends, Industry Drivers and Constraints, Historical and Forecast Market Analysis by Segment:
|
| Breakup by Transport Mode |
|
| Breakup by Application |
|
| Breakup by Region |
|
| Market Dynamics |
|
| Competitive Landscape |
|
| Companies Covered |
|
| Report Price and Purchase Option | Explore our purchase options that are best suited to your resources and industry needs. |
| Delivery Format | Delivered as an attached PDF and Excel through email, with an option of receiving an editable PPT, according to the purchase option. |
Datasheet
One User
USD 2,499
USD 2,249
tax inclusive*
Single User License
One User
USD 3,999
USD 3,599
tax inclusive*
Five User License
Five User
USD 4,999
USD 4,249
tax inclusive*
Corporate License
Unlimited Users
USD 5,999
USD 5,099
tax inclusive*
*Please note that the prices mentioned below are starting prices for each bundle type. Kindly contact our team for further details.*
Flash Bundle
Small Business Bundle
Growth Bundle
Enterprise Bundle
*Please note that the prices mentioned below are starting prices for each bundle type. Kindly contact our team for further details.*
Flash Bundle
Number of Reports: 3
20%
tax inclusive*
Small Business Bundle
Number of Reports: 5
25%
tax inclusive*
Growth Bundle
Number of Reports: 8
30%
tax inclusive*
Enterprise Bundle
Number of Reports: 10
35%
tax inclusive*
How To Order
Our step-by-step guide will help you select, purchase, and access your reports swiftly, ensuring you get the information that drives your decisions, right when you need it.

Select License Type
Choose the right license for your needs and access rights.

Click on ‘Buy Now’
Add the report to your cart with one click and proceed to register.

Select Mode of Payment
Choose a payment option for a secure checkout. You will be redirected accordingly.
Track prices with detailed trend reports.

Analyse trade data for supply chain insights.

Leverage cost reports for smart savings

Enhance supply chain with partnerships.

Gain insights to stay ahead and seize opportunities.

Get insights & trends for a competitive edge.

Track prices with detailed trend reports.
Analyse trade data for supply chain insights.
Leverage cost reports for smart savings
Enhance supply chain with partnerships.
Gain insights to stay ahead and seize opportunities.
Get insights & trends for a competitive edge.
Track prices with detailed trend reports.
Analyse trade data for supply chain insights.
Connect For More Information
Our expert team of analysts will offer full support and resolve any queries regarding the report, before and after the purchase.
Our expert team of analysts will offer full support and resolve any queries regarding the report, before and after the purchase.
We employ meticulous research methods, blending advanced analytics and expert insights to deliver accurate, actionable industry intelligence, staying ahead of competitors.
Our skilled analysts offer unparalleled competitive advantage with detailed insights on current and emerging markets, ensuring your strategic edge.
We offer an in-depth yet simplified presentation of industry insights and analysis to meet your specific requirements effectively.
Australia
63 Fiona Drive, Tamworth, NSW
+61-448-061-727
India
C130 Sector 2 Noida, Uttar Pradesh 201301
+91-723-689-1189
Philippines
40th Floor, PBCom Tower, 6795 Ayala Avenue Cor V.A Rufino St. Makati City,1226.
+63-287-899-028, +63-967-048-3306
United Kingdom
6 Gardner Place, Becketts Close, Feltham TW14 0BX, Greater London
+44-753-713-2163
United States
30 North Gould Street, Sheridan, WY 82801
+1-415-325-5166
Vietnam
193/26/4 St.no.6, Ward Binh Hung Hoa, Binh Tan District, Ho Chi Minh City
+84-865-399-124
United States (Head Office)
30 North Gould Street, Sheridan, WY 82801
+1-415-325-5166
Australia
63 Fiona Drive, Tamworth, NSW
+61-448-061-727
India
C130 Sector 2 Noida, Uttar Pradesh 201301
+91-723-689-1189
Philippines
40th Floor, PBCom Tower, 6795 Ayala Avenue Cor V.A Rufino St. Makati City, 1226.
+63-287-899-028, +63-967-048-3306
United Kingdom
6 Gardner Place, Becketts Close, Feltham TW14 0BX, Greater London
+44-753-713-2163
Vietnam
193/26/4 St.no.6, Ward Binh Hung Hoa, Binh Tan District, Ho Chi Minh City
+84-865-399-124


Share