

Consumer Insights
Uncover trends and behaviors shaping consumer choices today
Procurement Insights
Optimize your sourcing strategy with key market data
Industry Stats
Stay ahead with the latest trends and market analysis.

The global industrial wearable devices market reached a value of about USD 2.60 Billion in 2025. The industry is further expected to increase at a CAGR of nearly 9.50% between 2026 and 2035 to reach a value of about USD 6.44 Billion by 2035.
Base Year
Historical Period
Forecast Period
The increasing popularity of smart manufacturing is necessitating the demand for wearable devices to collect and transmit real-time data from workers to optimise processes, facilitate predictive maintenance, and improve decision-making. Reportedly, 49% of food and beverage manufacturers have adopted smart manufacturing as of 2023. As different sectors, including food and beverage, implement smart manufacturing, wearables tailored to meet the specific needs of different processes are witnessing a surge in demand.
The growing development of wearable exoskeletons (wearable robots) to reduce musculoskeletal injuries and lower worker compensation claims is boosting the industrial wearable devices market revenue. In June 2023, Comau and IUVO, in collaboration with Esselunga, developed a wearable exoskeleton to minimise lower back fatigue during repetitive and lifting tasks. Moreover, advancements in technology are also leading to the development of smart exoskeletons that can integrate with other wearable devices such as sensor-equipped garments and smart helmets to enhance the safety and productivity of workers.
With the rising trend of personalised safety, key players are creating industrial wearable devices that can track individual health metrics like blood oxygen levels, heart rates, fatigue, body temperature, and stress levels to provide personalised alerts to workers. Besides, the growing awareness regarding the impact of fatigue on industrial accidents is surging the demand for industrial wearable devices that can identify workers at risk of fatigue-related accidents.
Compound Annual Growth Rate
9.5%
Value in USD Billion
2026-2035
*this image is indicative*
North America is currently the leading region for the market, accounting for the majority of the market share. On the other hand, the Asia Pacific is projected to be one of the fastest-growing markets for industrial wearable devices due to factors like government initiatives including Made in China 2026, promoting the adoption of industrial IoT as well as smart manufacturing technologies, government aid for the adoption of advanced communications technologies like 5G, and the use of AR glasses as well as other wearables in automotive and other critical applications. The Chinese players' rising investments in AR technology are also likely to boost the Asia Pacific's industrial wearable devices market.
Growing focus on worker health and safety; advancements in battery technology; technological advancements and innovations; and increasing emphasis on sustainability are favouring the industrial wearable devices market expansion.
The growing focus on worker health and safety is driving the industrial wearable devices demand growth. Industrial wearable devices, including environmental sensors, radiation detectors, and gas sensors, are equipped with real-time sensors to monitor the health and safety of workers, enhance operational safety, and optimise productivity and efficiency in industrial settings.
Advancements in battery technology such as low-power components and more efficient battery chemistry aimed at enhancing the operational hours of wearables are shaping the industrial wearable devices market trends and dynamics. The creation of lightweight and compact batteries is also enabling the development of industrial wearable devices that can be worn for extended periods. Moreover, key players are exploring energy harvesting technologies (including solar energy) to lower the dependency on frequent charging.
Key players are deploying advanced technologies such as machine learning (ML) and artificial intelligence (AI) into industrial wearable devices to more accurately process sensor data, offer predictive analytics, detect potential safety hazards, and provide actionable insights in real-time.
The rising environmental consciousness and growing focus on reducing carbon footprint in major industries are driving the demand for energy-efficient wearables that minimise power consumption and reduce the need for frequent charging. There is also a growing use of eco-friendly, biodegradable, and recyclable materials to develop sustainable industrial wearables.


Wearable devices, also referred to as wearables, refer to gadgets that can be worn as clothes or accessories on the body. The major benefit these devices bring is their potential to connect to the internet as well as enable the sharing of data in real-time. The ubiquity of smartphones and internet access has resulted in the proliferation of wearable device technology both in the consumer and industrial markets over the last years. Specifically, in the industrial segment, these tools provide huge opportunities to reduce error rates, improve work efficiency, and improve workers' health. As a result, these tools are experiencing rapid adoption in various verticals from the retail to manufacturing industries.
Based on the product, the market can be divided into the following:
They find wide applications in the following sectors:
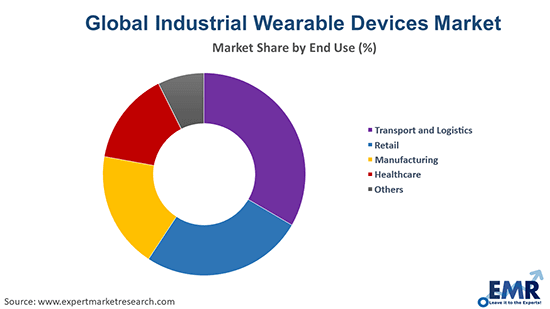
The end-use segments in the industry can be segmented as follows:
Market Breakup by Region:
Read more about this report - REQUEST FREE SAMPLE COPY IN PDF
Wearable devices include different sensors that can monitor data related to the vital signs, health, or position of the user. The growing R&D activities and incorporation of virtual reality as well as augmented reality in these apps have contributed to their use in applications ranging from educating new workers to recovery of motor functions. Keeping this in mind, companies in the market are developing wearables for market-specific applications. For example, for the healthcare sector, smart glasses are being created to promote expert communication, knowledge sharing as well as hands-free access to patient information. Similarly, businesses use safety alarms for workers working in dangerous conditions, including mines, building sites, and various manufacturing facilities. Several organizations often have exercise monitoring as part of their wellness services, where these devices have information about an employee's health status along with personalised health advice. This is expected to improve productivity and minimise the number of sick days. All these trends are together likely to boost the market growth.
Key industrial wearable devices market players are focusing on technological advancements to develop innovative devices for improving decision-making and troubleshooting and reducing the risk of workplace accidents. Industrial wearable devices companies are also integrating advanced analytics and cloud-based platforms to facilitate real-time monitoring and collection of operational data to optimise workplace performance.
Apple Inc, established in 1976 and headquartered in California, United States, is a leading technology company that offers hardware, software, and services. Some of its prominent products include personal computers (MacBook), smartphones (iPhone), and tablets (iPad). In 2014, the company forayed into the wearable devices market with the launch of the Apple Watch.
Fitbit, Inc., headquartered in California, United States, and founded in 2007, is a company that manufactures wearable fitness and wireless-enabled devices. It offers personalised health and well-being experiences for customers, providers, payers, employers, and partners. Fitbit has played a critical role in health and wellness research, powering over 1,700 interventions and studies across various focus areas.
*Please note that this is only a partial list; the complete list of key players is available in the full report. Additionally, the list of key players can be customized to better suit your needs.*
The comprehensive EMR report provides an in-depth assessment of the market based on the Porter's five forces model along with giving a SWOT analysis.


Upto 15% Off
USD
$3999 $3599
$2499 $2249
$4999 $4249
$5999 $5099


*While we strive to always give you current and accurate information, the numbers depicted on the website are indicative and may differ from the actual numbers in the main report. At Expert Market Research, we aim to bring you the latest insights and trends in the market. Using our analyses and forecasts, stakeholders can understand the market dynamics, navigate challenges, and capitalize on opportunities to make data-driven strategic decisions.*
Get in touch with us for a customized solution tailored to your unique requirements and save upto 35%!
In 2025, the global industrial wearable devices market attained a value of nearly USD 2.60 Billion.
The market is projected to grow at a CAGR of 9.50% between 2026 and 2035.
The market is estimated to witness a healthy growth in the forecast period of 2026-2035 to reach about USD 6.44 Billion by 2035.
The major drivers of the market are the growing research and development activities by key players, incorporation of virtual reality as well as augmented reality in apps, and rising demand for industrial wearable devices from different end-user sectors.
The key trends guiding the growth of the market include the development of wearables for market-specific applications and rising disposable incomes.
The major regions in the market are North America, Latin America, the Middle East and Africa, Europe, and the Asia Pacific.
The significant end uses of industrial wearable devices are transport and logistics, retail, manufacturing, and healthcare, among others.
The major players in the industrial wearables devices market are Apple Inc and Fitbit, Inc., among others.
Explore our key highlights of the report and gain a concise overview of key findings, trends, and actionable insights that will empower your strategic decisions.
| REPORT FEATURES | DETAILS |
| Base Year | 2025 |
| Historical Period | 2019-2025 |
| Forecast Period | 2026-2035 |
| Scope of the Report |
Historical and Forecast Trends, Industry Drivers and Constraints, Historical and Forecast Market Analysis by Segment:
|
| Breakup by Product |
|
| Breakup by Application |
|
| Breakup by End Use |
|
| Breakup by Region |
|
| Market Dynamics |
|
| Competitive Landscape |
|
| Companies Covered |
|
| Report Price and Purchase Option | Explore our purchase options that are best suited to your resources and industry needs. |
| Delivery Format | Delivered as an attached PDF and Excel through email, with an option of receiving an editable PPT, according to the purchase option. |
Single User License
One User
USD 3,999
USD 3,599
tax inclusive*
Datasheet
One User
USD 2,499
USD 2,249
tax inclusive*
Five User License
Five User
USD 4,999
USD 4,249
tax inclusive*
Corporate License
Unlimited Users
USD 5,999
USD 5,099
tax inclusive*
*Please note that the prices mentioned below are starting prices for each bundle type. Kindly contact our team for further details.*
Flash Bundle
Small Business Bundle
Growth Bundle
Enterprise Bundle
*Please note that the prices mentioned below are starting prices for each bundle type. Kindly contact our team for further details.*
Flash Bundle
Number of Reports: 3
20%
tax inclusive*
Small Business Bundle
Number of Reports: 5
25%
tax inclusive*
Growth Bundle
Number of Reports: 8
30%
tax inclusive*
Enterprise Bundle
Number of Reports: 10
35%
tax inclusive*
How To Order

Select License Type
Choose the right license for your needs and access rights.

Click on ‘Buy Now’
Add the report to your cart with one click and proceed to register.

Select Mode of Payment
Choose a payment option for a secure checkout. You will be redirected accordingly.
Gain insights to stay ahead and seize opportunities.

Get insights & trends for a competitive edge.

Track prices with detailed trend reports.

Analyse trade data for supply chain insights.

Leverage cost reports for smart savings

Enhance supply chain with partnerships.

Connect For More Information
Our expert team of analysts will offer full support and resolve any queries regarding the report, before and after the purchase.
Our expert team of analysts will offer full support and resolve any queries regarding the report, before and after the purchase.
We employ meticulous research methods, blending advanced analytics and expert insights to deliver accurate, actionable industry intelligence, staying ahead of competitors.
Our skilled analysts offer unparalleled competitive advantage with detailed insights on current and emerging markets, ensuring your strategic edge.
We offer an in-depth yet simplified presentation of industry insights and analysis to meet your specific requirements effectively.


Share