

Consumer Insights
Uncover trends and behaviors shaping consumer choices today
Procurement Insights
Optimize your sourcing strategy with key market data
Industry Stats
Stay ahead with the latest trends and market analysis.
The Indonesia industrial and automotive lubricant market size reached around USD 795.40 Million in 2024. The market is projected to grow at a CAGR of 5.40% between 2025 and 2034 to reach nearly USD 1345.83 Million by 2034. The market growth can be attributed to the rapid industrialisation and economic growth of Indonesia, apart from the rising demand for passenger and commercial vehicles.
Base Year
Historical Period
Forecast Period
The growth of Indonesia’s industrial and automotive lubricant market is closely linked to the expansion of the construction industry. As construction activities increase, there is a higher demand for heavy machinery and vehicles, driving the need for lubricants that ensure better performance and durability. Additionally, the construction sector’s focus on efficiency and sustainability has led to a growing preference for eco-friendly, high-performance lubricants, supporting the Indonesia industrial and automotive lubricant market growth.
Growing infrastructure development and the expanding mining sector in Indonesia are boosting demand for industrial lubricants, particularly heavy-duty oils. Additionally, the surge in automotive ownership and preference for fuel-efficient vehicles are driving the automotive lubricant demand growth.
The Indonesia industrial and automotive lubricant market is witnessing rapid growth due to rising industrialisation and expanding automotive production. The demand for high-performance lubricants, particularly synthetic and eco-friendly variants, is increasing as industries and consumers prioritise efficiency and sustainability. This trend, supported by stringent environmental regulations, is encouraging innovation and creating opportunities for market players to introduce advanced products.


Value in USD Million
2025-2034
Indonesia Industrial and Automotive Lubricant Market Outlook
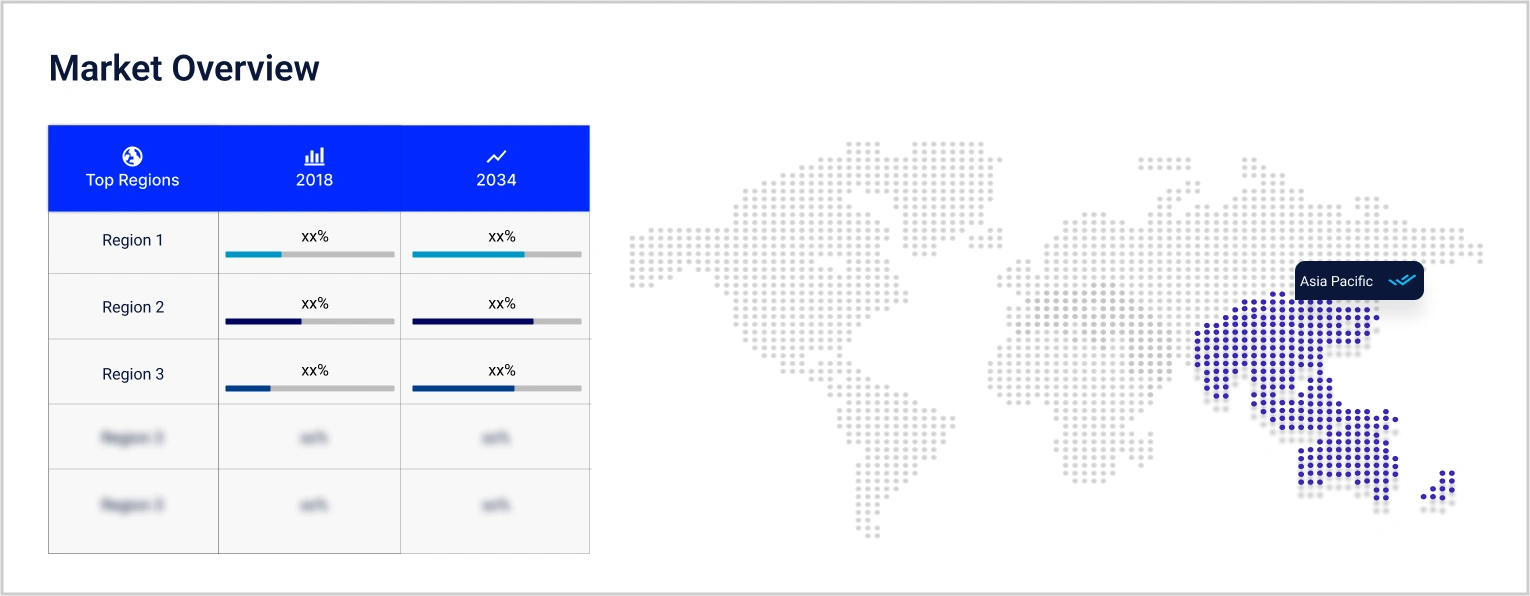
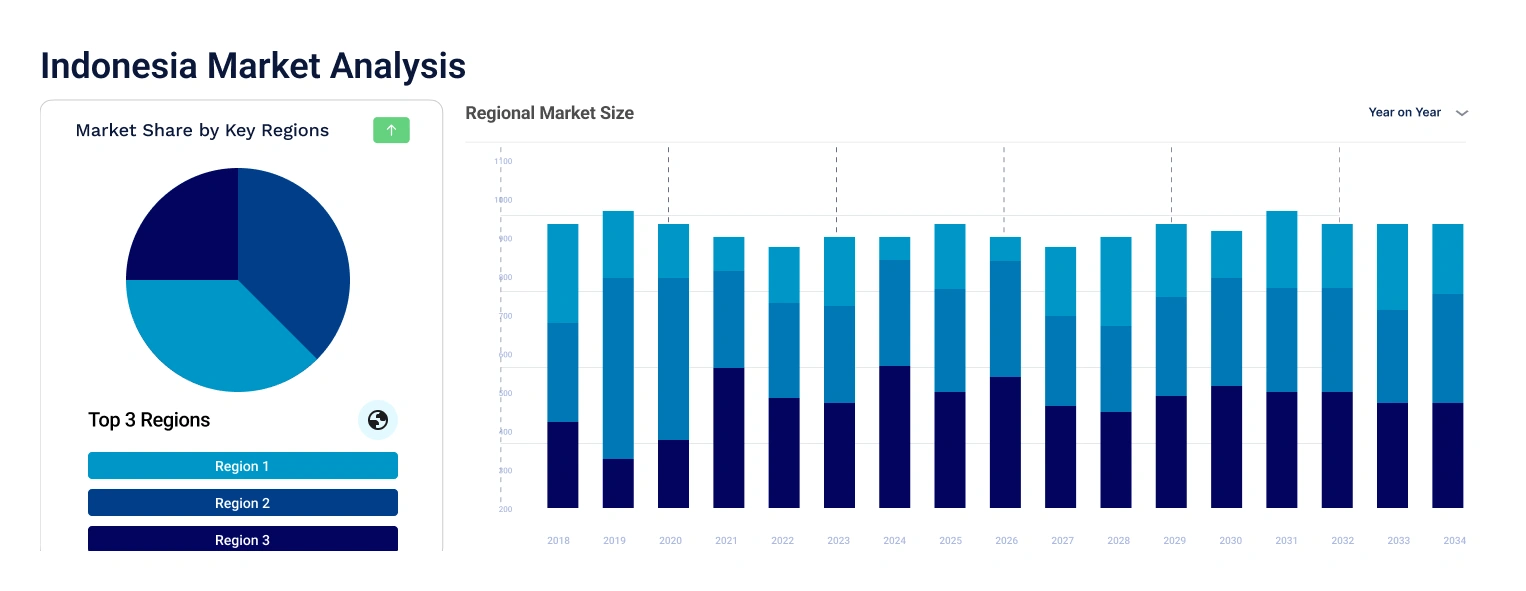
*this image is indicative*
|
Indonesia Industrial and Automotive Lubricant Market Report Summary |
Description |
Value |
|
Base Year |
USD Million |
2024 |
|
Historical Period |
USD Million |
2018-2024 |
|
Forecast Period |
USD Million |
2025-2034 |
|
Market Size 2024 |
USD Million |
795.40 |
|
Market Size 2034 |
USD Million |
1345.83 |
|
CAGR 2018-2024 |
Percentage |
XX% |
|
CAGR 2025-2034 |
Percentage |
5.40% |
|
CAGR 2025-2034 - Market by By Product Type |
Engine Oil |
6.2% |
|
CAGR 2025-2034 - Market by By Application |
Two-Wheeler |
6.1% |
As per the industry analysis, Indonesian consumers prefer purchasing lubricants from eco-conscious brands that preserve natural resources and promote habitat protection. This has prompted companies to switch towards producing biodegradable lubricants that reduce the risk of environmental damage due to accidental spills and releases. This is one of the key Indonesia industrial and automotive lubricant market trends. Biodegradable lubricants are derived from vegetable oils or synthetic, non-toxic materials that decompose easily in soil and water. They also enable lubricant manufacturers to ensure compliance with environmental regulations and deliver on consumer expectations.
Technological advancements in lubricant production can potentially reduce carbon emissions and enable automotive rental companies to save on fleet maintenance costs. This is favourably shaping the Indonesia industrial and automotive lubricant market dynamics. Moreover, with the expansion of Indonesia’s logistics industry (from IDR 689 trillion to over IDR 1.2 quadrillion of GDP contribution during 2020-23), the demand for sustainably packaged lubricants is expected to increase steadily. According to industry reports, packaging made from natural polymers is expected to require 35% less energy as compared to solutions derived from petroleum-based polymers. This is creating a favourable Indonesia industrial and automotive lubricant market outlook.
Increasing automotive production; the emergence of Industry 4.0; the expansion of the construction industry; and the growing switch to premium lubricants are the major factors driving the Indonesia industrial and automotive lubricant market growth.
As per the Association of Indonesia Automotive Industries, over 800,000 new ICE and battery-powered vehicles were sold in Indonesia in 2021. Moreover, the Indonesian Motorbike Association suggests that Indonesian consumers purchased over 5 million new motorcycles during that period. This is expected to contribute to Indonesia industrial and automotive lubricant market development in the coming years.
Industry 4.0 is expected to revolutionise how companies produce, improve, and distribute their lubricants across Indonesia. The process of selecting and evaluating final products has become increasingly digitised, end users are relying on data measurement systems to understand lubricant performance and make informed decisions. This is contributing to the Indonesia industrial and automotive lubricant market development.
The construction sector is the fourth largest industry in Indonesia’s economy. In Q1 of FY-2024, it accounted for nearly 10.23% of the national GDP. The rising sales of heavy construction machinery and drilling equipment are expected to increase the demand for high-performance lubricants to ensure the longevity of products and maximise the ROI on a company’s capital expenditure.
Indonesia-based automotive companies are seeking premium lubricants with superior film strength, oxidative stability, low viscosity index, foam suppression capabilities, and excellent moisture-handling ability. This is imperative for reducing machine loss and enhancing the fuel efficiency of automobiles.
Expansion of construction industry
The expansion of Indonesia’s construction industry is driving the demand for low-viscosity lubricants that considerably reduce the generation of heat and friction. A typical heavy construction machinery loses nearly 80% of its energy during operation, with only 20% of it getting transformed into useful mechanical work. This has prompted companies to switch to premium lubricants, which reduce energy losses by 0.5% per component, thereby incurring huge cost savings. This is expected to increase the Indonesia industrial and automotive lubricant market revenue in the coming years.
Emergence of Industry 4.0
Indonesia’s manufacturing industry accounts for nearly 18% of its GDP. Based on industry reports, rapid digitalisation of operations is expected to contribute a value of USD 120 billion to Indonesia’s economy by the end of 2025. With the increasing use of industrial robots across the automotive, consumer electronics, and food processing industries, the demand for premium lubricants is expected to surge rapidly, thereby leading to the Indonesia industrial and automotive lubricant market expansion.
The EMR’s report titled “Indonesia Industrial and Automotive Lubricant Market Report and Forecast 2025-2034” offers a detailed analysis of the market based on the following segments:
Breakup by Product Type
Breakup by Type
Breakup by Engine Type
Breakup by Sales Channel
Breakup by Application
Based on application, the market is segmented into passenger and commercial vehicle, oil and gas, construction and mining, and two-wheeler, among others. Over the forecast period of 2025-2034, the application of industrial and automotive lubricants in two-wheelers and passenger and commercial vehicles is expected to grow at a CAGR of 6.1% and 5.8% respectively, as MNCs expand their network of aftersales service centres across the region.
Based on product type, the market is segmented into metal working fluid, engine oil, gear oil, hydraulic oil, and marine oil, among others. Over the forecast period of 2025-2034, the demand for engine oils and gear oils is expected to grow at a CAGR of 6.2% and 5.8% respectively, due to technological advancements and rapid industrial growth.
|
CAGR 2025-2034 - Market by |
By Product Type |
|
Engine Oil |
6.2% |
|
Gear Oil |
5.8% |
|
Metal Working Fluid |
XX% |
|
Hydraulic Oil |
XX% |
|
Others |
XX% |
Major market players are investing in advanced lubricant formulations to enhance engine efficiency and equipment performance. They are expanding their distribution networks to reach remote areas and focusing on eco-friendly and synthetic lubricant products to align with environmental regulations. Additionally, partnerships with automotive and industrial manufacturers are expected to strengthen their market presence, thereby bolstering the Indonesia industrial and automotive lubricant market development.
The Lubrizol Corporation was founded in 1928 and is headquartered in Ohio, United States. It is a speciality chemicals company that produces engineered polymers and performance costings (among other products) across its 100 production facilities worldwide.
Chevron Oronite was founded in 1917 and is headquartered in California, United States. It is a world-class developer, producer, and marketer of fuel additives and lubricants designed to enhance the performance of industrial equipment and passenger and commercial vehicles.
Infineum International Limited was founded in 1999 and is headquartered in Oxfordshire, England. It is a joint venture company of ExxonMobil and Shell and specialises in formulating petroleum additives for producing lubricants.
*Please note that this is only a partial list; the complete list of key players is available in the full report. Additionally, the list of key players can be customized to better suit your needs.*
*While we strive to always give you current and accurate information, the numbers depicted on the website are indicative and may differ from the actual numbers in the main report. At Expert Market Research, we aim to bring you the latest insights and trends in the market. Using our analyses and forecasts, stakeholders can understand the market dynamics, navigate challenges, and capitalize on opportunities to make data-driven strategic decisions.*
Get in touch with us for a customized solution tailored to your unique requirements and save upto 35%!
In 2024, the market reached an approximate value of USD 795.40 Million.
The market is projected to grow at a CAGR of 5.40% between 2025 and 2034.
The market is estimated to witness healthy growth in the forecast period of 2025-2034 to reach a value of around USD 1345.83 Million by 2034.
The different types of products in the market include metal working fluid, engine oil, gear oil, hydraulic oil, and marine oil, among others.
The different types of lubricants available in Indonesia include mineral, semi-synthetic, and fully synthetic, among others.
The different applications of industrial and automotive lubricants include passenger and commercial vehicle, oil and gas, construction and mining, and two-wheeler, among others.
Key players in the market are The Lubrizol Corporation, Chevron Oronite, and Infineum International Limited, among others.
Explore our key highlights of the report and gain a concise overview of key findings, trends, and actionable insights that will empower your strategic decisions.
| REPORT FEATURES | DETAILS |
| Base Year | 2024 |
| Historical Period | 2018-2024 |
| Forecast Period | 2025-2034 |
| Scope of the Report |
Historical and Forecast Trends, Industry Drivers and Constraints, Historical and Forecast Market Analysis by Segment:
|
| Breakup by Product Type |
|
| Breakup by Type |
|
| Breakup by Engine Type |
|
| Breakup by Sales Channel |
|
| Breakup by Application |
|
| Market Dynamics |
|
| Competitive Landscape |
|
| Companies Covered |
|
Datasheet
One User
USD 3,499
USD 3,149
tax inclusive*
Single User License
One User
USD 5,499
USD 4,949
tax inclusive*
Five User License
Five User
USD 6,999
USD 5,949
tax inclusive*
Corporate License
Unlimited Users
USD 8,324
USD 7,075
tax inclusive*
*Please note that the prices mentioned below are starting prices for each bundle type. Kindly contact our team for further details.*
Flash Bundle
Small Business Bundle
Growth Bundle
Enterprise Bundle
*Please note that the prices mentioned below are starting prices for each bundle type. Kindly contact our team for further details.*
Flash Bundle
Number of Reports: 3
20%
tax inclusive*
Small Business Bundle
Number of Reports: 5
25%
tax inclusive*
Growth Bundle
Number of Reports: 8
30%
tax inclusive*
Enterprise Bundle
Number of Reports: 10
35%
tax inclusive*
How To Order
Our step-by-step guide will help you select, purchase, and access your reports swiftly, ensuring you get the information that drives your decisions, right when you need it.

Select License Type
Choose the right license for your needs and access rights.

Click on ‘Buy Now’
Add the report to your cart with one click and proceed to register.

Select Mode of Payment
Choose a payment option for a secure checkout. You will be redirected accordingly.
Track prices with detailed trend reports.

Analyse trade data for supply chain insights.

Leverage cost reports for smart savings

Enhance supply chain with partnerships.

Gain insights to stay ahead and seize opportunities.

Get insights & trends for a competitive edge.

Track prices with detailed trend reports.
Analyse trade data for supply chain insights.
Leverage cost reports for smart savings
Enhance supply chain with partnerships.
Gain insights to stay ahead and seize opportunities.
Get insights & trends for a competitive edge.
Track prices with detailed trend reports.
Analyse trade data for supply chain insights.
Connect For More Information
Our expert team of analysts will offer full support and resolve any queries regarding the report, before and after the purchase.
Our expert team of analysts will offer full support and resolve any queries regarding the report, before and after the purchase.
We employ meticulous research methods, blending advanced analytics and expert insights to deliver accurate, actionable industry intelligence, staying ahead of competitors.
Our skilled analysts offer unparalleled competitive advantage with detailed insights on current and emerging markets, ensuring your strategic edge.
We offer an in-depth yet simplified presentation of industry insights and analysis to meet your specific requirements effectively.
Australia
63 Fiona Drive, Tamworth, NSW
+61-448-061-727
India
C130 Sector 2 Noida, Uttar Pradesh 201301
+91-723-689-1189
Philippines
40th Floor, PBCom Tower, 6795 Ayala Avenue Cor V.A Rufino St. Makati City,1226.
+63-287-899-028, +63-967-048-3306
United Kingdom
6 Gardner Place, Becketts Close, Feltham TW14 0BX, Greater London
+44-753-713-2163
United States
30 North Gould Street, Sheridan, WY 82801
+1-415-325-5166
Vietnam
193/26/4 St.no.6, Ward Binh Hung Hoa, Binh Tan District, Ho Chi Minh City
+84-865-399-124
United States (Head Office)
30 North Gould Street, Sheridan, WY 82801
+1-415-325-5166
Australia
63 Fiona Drive, Tamworth, NSW
+61-448-061-727
India
C130 Sector 2 Noida, Uttar Pradesh 201301
+91-723-689-1189
Philippines
40th Floor, PBCom Tower, 6795 Ayala Avenue Cor V.A Rufino St. Makati City, 1226.
+63-287-899-028, +63-967-048-3306
United Kingdom
6 Gardner Place, Becketts Close, Feltham TW14 0BX, Greater London
+44-753-713-2163
Vietnam
193/26/4 St.no.6, Ward Binh Hung Hoa, Binh Tan District, Ho Chi Minh City
+84-865-399-124


Share