

Consumer Insights
Uncover trends and behaviors shaping consumer choices today
Procurement Insights
Optimize your sourcing strategy with key market data
Industry Stats
Stay ahead with the latest trends and market analysis.
The Indonesia barge fleet market size is expected to grow in the forecast period of 2025-2034 at a CAGR of 4.70%. The market is being driven by the growing transportation market, along with the rising import and export activities in the country.
Base Year
Historical Period
Forecast Period
Barges used in Indonesia can range from 180 feet to 365 feet, carrying a total capacity of 12,000 MT.
Indonesia had one of the largest tog fleets, with 3,600 vessels being registered in 2017.
Reportedly, the export and import of fish in Indonesia amounted to 1,243,838 metric tons in 2020.


Value in USD Million
2025-2034
Indonesia Barge Fleet Market Outlook
*this image is indicative*
| Indonesia Barge Fleet Market Report Summary | Description | Value |
| Base Year | USD Million | 2024 |
| Historical Period | USD Million | 2018-2024 |
| Forecast Period | USD Million | 2025-2034 |
| Market Size 2024 | USD Million | 658.4 |
| Market Size 2034 | USD Million | 1,920.8 |
| CAGR 2018-2024 | Percentage | XX% |
| CAGR 2025-2034 | Percentage | 4.70% |
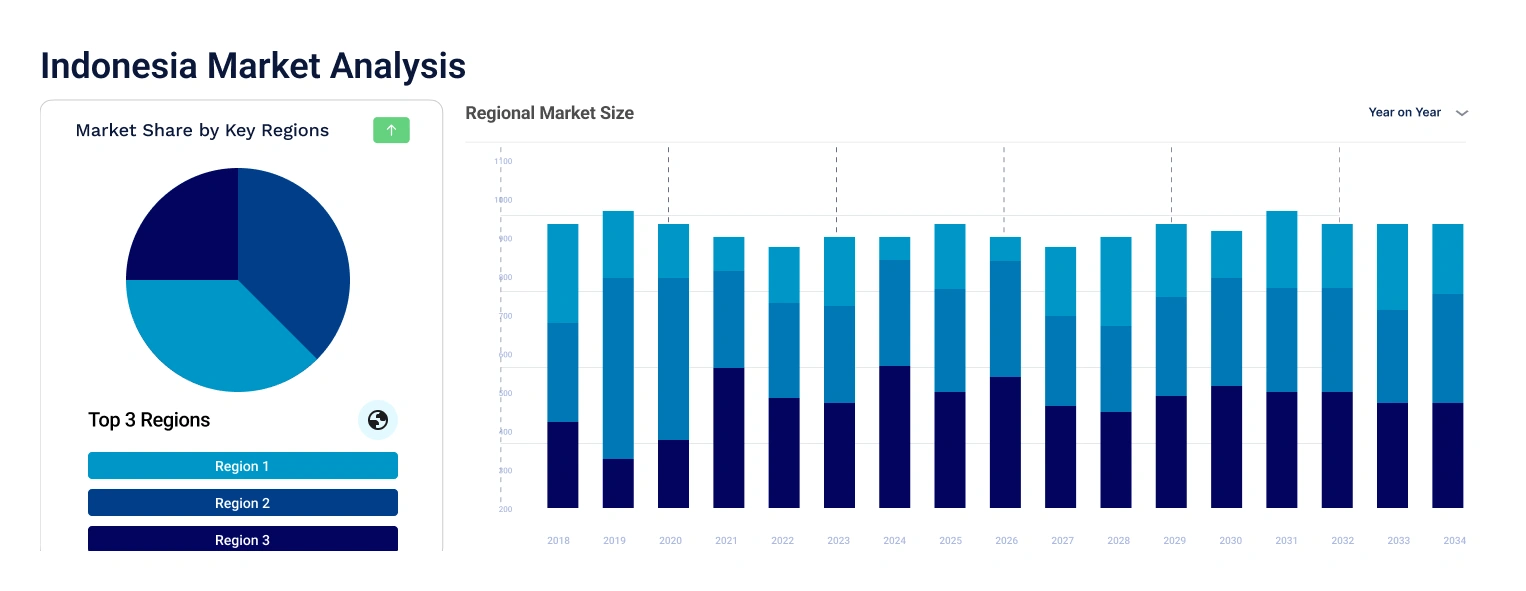
| CAGR 2025-2034 - Market by Region | Sumatra | 5.0% |
| CAGR 2025-2034 - Market by Region | Sulawesi | 4.2% |
| CAGR 2025-2034 - Market by Type | Covered Barge | 5.6% |
| CAGR 2025-2034 - Market by End Use | Agricultural Products | 5.6% |
| 2024 Market Share by Region | Kalimantan | 54.0% |
A barge is a specialised type of boat designed primarily for transporting cargo or passengers along rivers, canals, and other inland waterways. These vessels are typically long, flat-bottomed boats that are towed or pushed by tugboats, as they do not have their propulsion systems. This design allows barges to navigate shallow waters and carry large or heavy loads that may be impractical for other types of vessels.
Barges are commonly used for transporting bulk goods such as coal, grain, and raw materials for manufacturing. They are also used for transporting oversized or heavy equipment, such as machinery or construction materials, that cannot easily be transported by road or rail.
The Indonesia barge fleet market is being driven by several key benefits associated with barge transportation. One of the primary advantages is the efficiency of barge transportation, especially for bulk cargo. Barges can carry large volumes of cargo in a single trip, reducing the number of trips needed compared to other modes of transportation. This efficiency not only saves time but also reduces fuel consumption and carbon emissions, making barge transportation an environmentally friendly option.
Read more about this report - REQUEST FREE SAMPLE COPY IN PDF
Growing demand for barge logistics; infrastructure expansion of waterways and ports; shift towards eco-friendly solutions, and technology integration for fleet management are positively impacting the barge fleet market growth
There is an increasing demand for barge transportation in Indonesia due to its cost-effectiveness, efficiency, and ability to transport large volumes of cargo.
The Indonesian government is investing in infrastructure development, including ports and waterways, which is expected to boost the demand for barge transportation.
There is a growing trend towards using eco-friendly barge fleets, such as those powered by clean energy sources, to reduce environmental impact.
The integration of technology, such as GPS tracking and digital systems for fleet management, is improving the efficiency and safety of barge fleets.
Barges have lower operating costs compared to trucks or trains, primarily due to their lower fuel consumption and smaller crew requirements. Additionally, barge transportation is often less affected by traffic congestion or road maintenance issues, further reducing costs and ensuring timely delivery of goods.
In terms of security and safety of cargo, barge transportation is generally more stable than other modes of transportation, reducing the risk of cargo damage or loss due to accidents or rough seas. Additionally, barge transportation is less susceptible to theft or vandalism compared to road or rail transportation, providing added security for valuable cargo.
The growing adoption of eco-friendly barges amid the need to comply with global environmental regulations that limit emissions of greenhouse gases and pollutants is propelling the Indonesia barge fleet market expansion. Organisations such as the International Maritime Organisation (IMO) have set stringent emissions standards that are pushing the barge fleet operators towards cleaner energy sources.
Additionally, there is growing public and stakeholder awareness about the environmental impacts of shipping, which is prompting companies to adopt greener practices to maintain their public image and customer base. Furthermore, the potential for long-term cost savings through improved fuel efficiency and reduced dependency on volatile fossil fuel markets is a compelling economic incentive.
“Indonesia Barge Fleet Market Report and Forecast 2025-2034” offers a detailed analysis of the market based on the following segments:
Market Breakup by Type
Market Breakup by Tonnage Capacity
Market Breakup by Application
Market Breakup by Region
Read more about this report - REQUEST FREE SAMPLE COPY IN PDF
| CAGR 2025-2034 - Market by | Type |
| Covered Barge | 5.6% |
| Open Barge | XX% |
| CAGR 2025-2034 - Market by | End Use |
| Agricultural Products | 5.6% |
| Coke and Refined Petroleum Products | 5.0% |
| Coal and other bulk material | XX% |
| Crude Petroleum Products | XX% |
| Chemical and Petrochemical | XX% |
| Food Products, Beverages, and Tobacco | 5.8% |
| Others | XX% |
| CAGR 2025-2034 - Market by | Region |
| Sumatra | 5.0% |
| Sulawesi | 4.2% |
| Java | XX% |
| Kalimantan | XX% |
| Others | XX% |
Rising demand for energy has enhanced the need for barge fleet for transporting coal and petroleum
Coal and crude petroleum products dominate the Indonesia barge fleet market share, driven by escalating ethanol production and rising crude oil demand in Indonesia. Coal, a principal mining product in Indonesia, is also a vital export commodity. Barges play a crucial role in transporting coal across Indonesian ports, with numerous operators employing barges for this purpose.
Additionally, agricultural products are poised to bolster the growth of the Indonesia barge fleet market in the forthcoming years. This growth is attributed to the expanding use of barges for transporting agricultural produce.
Major players in the Indonesia barge fleet market are focusing on expanding their services:
Habco Indonesia is an Indonesia-based company that was founded in 1991 and offers inter-island voyage services through the Indonesian archipelago. The company is entirely committed to offering an integrated marine solution to its consumers through its multiple business units. Its several business units synergise to provide an exceptional end-to-end marine logistic solution that connects every shipper to its respective clients.
GAC Indonesia Shipping was established in 1997 in Indonesia. It has a solid base in the local shipping as well as logistics industries through its partnership with PT Andhika Lines. It offers a complete variety of vessels containing dry cargo, tanker, navy, offshore, and cruise vessels.
PT Pelayaran Nasional Bina Buana Raya Tbk is a shipping agency company that was founded in 1998 in Indonesia. The company has a huge fleet of barges and tugboats as well as offshore vessels to meet the logistics demand of sea transportation. It has two key business divisions in the form of the Tug & Barge Division and the Offshore Division.
Gurita Lintas Samudera, based in Jakarta Barat, Indonesia, is a prominent player in the deep sea freight transportation sector. Established in 1971, the company has evolved over the years, originally operating under different names before adopting its current identity in 1988. Gurita Lintas Samudera offers a comprehensive range of shipping services that cater to both international and domestic markets.
*Please note that this is only a partial list; the complete list of key players is available in the full report. Additionally, the list of key players can be customized to better suit your needs.*
Other key players in the Indonesia barge fleet market are PT Sillo Maritime Perdana TBK, among others.
Companies in the Indonesia barge fleet market are experiencing growth, primarily driven by several key factors, including the robust expansion of the mining and agricultural sectors. Notably, Indonesia is one of the top exporters of coal, a majority of which is transported domestically and internationally via barges. This makes barge transportation a cost-effective and preferred method for bulk commodities like coal and crude palm oil, which are abundant in the region.

Read more about this report - REQUEST FREE SAMPLE COPY IN PDF
Jakarta, as the capital area, is a significant hub for barge fleets. This region plays a crucial role in the country's transportation and logistics due to its strategic location and extensive waterway networks. The barge fleet in Jakarta is primarily engaged in transporting bulk commodities such as coal, crude petroleum products, and agricultural goods, which are essential for supporting Indonesia's heavy reliance on these industries for economic growth.
| 2024 Market Share by | Region |
| Kalimantan | 54.0% |
| Java | XX% |
| Sumatra | XX% |
| Sulawesi | XX% |
| Others | XX% |
The importance of Jakarta in the Indonesia barge fleet market is also highlighted by the presence of major shipping and logistics companies. These companies utilise the waterways to optimise transport costs and efficiency, given the lower expenses associated with water transport compared to road and rail, particularly for heavy and bulk goods.
*While we strive to always give you current and accurate information, the numbers depicted on the website are indicative and may differ from the actual numbers in the main report. At Expert Market Research, we aim to bring you the latest insights and trends in the market. Using our analyses and forecasts, stakeholders can understand the market dynamics, navigate challenges, and capitalize on opportunities to make data-driven strategic decisions.*
Get in touch with us for a customized solution tailored to your unique requirements and save upto 35%!
The market is assessed to grow at a CAGR of 4.70% between 2025 and 2034.
The major market drivers are the surging export and import trade activities, along with the growing transportation sector in the country.
The key market trends include the growing demand for cost-effective conveyance and an upsurge in the demand for coal to meet the rising energy needs.
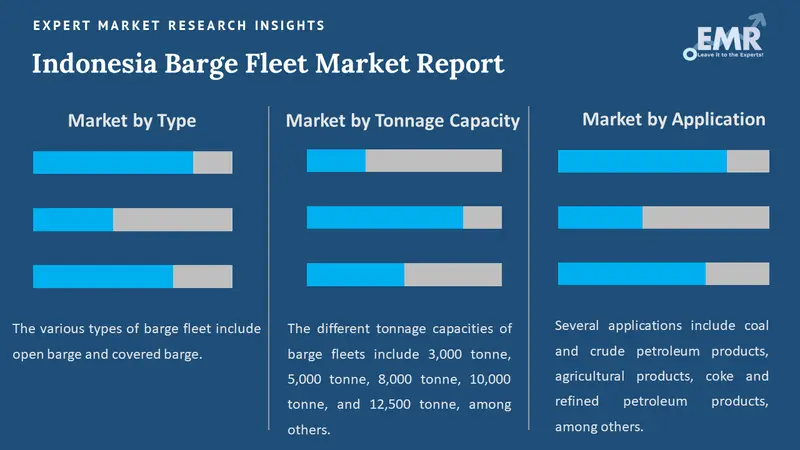
The various types of barge fleets include open barge and covered barge.
The several applications of barge fleets include coal and crude petroleum products, agricultural products, coke and refined petroleum products, chemical and petrochemicals, and food products, beverages, and tobacco, among others.
The major regions in the market are the Capital Area (Jakarta), the Northeast Coast of Sumatra, the Southern Ports, the Northern Shores of Java, and the Western End of Surabaya.
The major players in the market are Habco Indonesia, GAC Indonesia Shipping, Gurita Lintas Samudera, PT Pelayaran Nasional Bina Buana Raya Tbk, and PT Sillo Maritime Perdana TBK, among others.
The purpose of a barge is to transport heavy and high-volume cargo across waterways such as rivers and canals.
Explore our key highlights of the report and gain a concise overview of key findings, trends, and actionable insights that will empower your strategic decisions.
| REPORT FEATURES | DETAILS |
| Base Year | 2024 |
| Historical Period | 2018-2024 |
| Forecast Period | 2025-2034 |
| Scope of the Report |
Historical and Forecast Trends, Industry Drivers and Constraints, Historical and Forecast Market Analysis by Segment:
|
| Breakup by Type |
|
| Breakup by Tonnage Capacity |
|
| Breakup by Application |
|
| Breakup by Region |
|
| Market Dynamics |
|
| Competitive Landscape |
|
| Companies Covered |
|
Datasheet
One User
USD 2,999
USD 2,699
tax inclusive*
Single User License
One User
USD 4,399
USD 3,959
tax inclusive*
Five User License
Five User
USD 5,599
USD 4,759
tax inclusive*
Corporate License
Unlimited Users
USD 6,659
USD 5,660
tax inclusive*
*Please note that the prices mentioned below are starting prices for each bundle type. Kindly contact our team for further details.*
Flash Bundle
Small Business Bundle
Growth Bundle
Enterprise Bundle
*Please note that the prices mentioned below are starting prices for each bundle type. Kindly contact our team for further details.*
Flash Bundle
Number of Reports: 3
20%
tax inclusive*
Small Business Bundle
Number of Reports: 5
25%
tax inclusive*
Growth Bundle
Number of Reports: 8
30%
tax inclusive*
Enterprise Bundle
Number of Reports: 10
35%
tax inclusive*
How To Order
Our step-by-step guide will help you select, purchase, and access your reports swiftly, ensuring you get the information that drives your decisions, right when you need it.

Select License Type
Choose the right license for your needs and access rights.

Click on ‘Buy Now’
Add the report to your cart with one click and proceed to register.

Select Mode of Payment
Choose a payment option for a secure checkout. You will be redirected accordingly.
Track prices with detailed trend reports.

Analyse trade data for supply chain insights.

Leverage cost reports for smart savings

Enhance supply chain with partnerships.

Gain insights to stay ahead and seize opportunities.

Get insights & trends for a competitive edge.

Track prices with detailed trend reports.
Analyse trade data for supply chain insights.
Leverage cost reports for smart savings
Enhance supply chain with partnerships.
Gain insights to stay ahead and seize opportunities.
Get insights & trends for a competitive edge.
Track prices with detailed trend reports.
Analyse trade data for supply chain insights.
Connect For More Information
Our expert team of analysts will offer full support and resolve any queries regarding the report, before and after the purchase.
Our expert team of analysts will offer full support and resolve any queries regarding the report, before and after the purchase.
We employ meticulous research methods, blending advanced analytics and expert insights to deliver accurate, actionable industry intelligence, staying ahead of competitors.
Our skilled analysts offer unparalleled competitive advantage with detailed insights on current and emerging markets, ensuring your strategic edge.
We offer an in-depth yet simplified presentation of industry insights and analysis to meet your specific requirements effectively.
Australia
63 Fiona Drive, Tamworth, NSW
+61-448-061-727
India
C130 Sector 2 Noida, Uttar Pradesh 201301
+91-723-689-1189
Philippines
40th Floor, PBCom Tower, 6795 Ayala Avenue Cor V.A Rufino St. Makati City,1226.
+63-287-899-028, +63-967-048-3306
United Kingdom
6 Gardner Place, Becketts Close, Feltham TW14 0BX, Greater London
+44-753-713-2163
United States
30 North Gould Street, Sheridan, WY 82801
+1-415-325-5166
Vietnam
193/26/4 St.no.6, Ward Binh Hung Hoa, Binh Tan District, Ho Chi Minh City
+84-865-399-124
United States (Head Office)
30 North Gould Street, Sheridan, WY 82801
+1-415-325-5166
Australia
63 Fiona Drive, Tamworth, NSW
+61-448-061-727
India
C130 Sector 2 Noida, Uttar Pradesh 201301
+91-723-689-1189
Philippines
40th Floor, PBCom Tower, 6795 Ayala Avenue Cor V.A Rufino St. Makati City, 1226.
+63-287-899-028, +63-967-048-3306
United Kingdom
6 Gardner Place, Becketts Close, Feltham TW14 0BX, Greater London
+44-753-713-2163
Vietnam
193/26/4 St.no.6, Ward Binh Hung Hoa, Binh Tan District, Ho Chi Minh City
+84-865-399-124


Share