

Consumer Insights
Uncover trends and behaviors shaping consumer choices today
Procurement Insights
Optimize your sourcing strategy with key market data
Industry Stats
Stay ahead with the latest trends and market analysis.

The India webcam market reached around USD 278.34 Million in 2025. The market is projected to grow at a CAGR of 9.00% between 2026 and 2035 to reach nearly USD 658.93 Million by 2035.
Base Year
Historical Period
Forecast Period
India’s online education industry grew by 7 times between 2019 and 2020.
Live concerts featuring electronic dance music witnessed a growth of 65% in ticket sales in 2022 from 2019.
Music shows contribute nearly 25% of the annual revenues of major entertainment platforms.
Compound Annual Growth Rate
9%
Value in USD Million
2026-2035
*this image is indicative*
| India Webcam Market Report Summary | Description | Value |
| Base Year | USD Million | 2025 |
| Historical Period | USD Million | 2019-2025 |
| Forecast Period | USD Million | 2026-2035 |
| Market Size 2025 | USD Million | 278.34 |
| Market Size 2035 | USD Million | 658.93 |
| CAGR 2019-2025 | Percentage | XX% |
| CAGR 2026-2035 | Percentage | 9.00% |
| CAGR 2026-2035 - Market by Region | East India | 9.4% |
| CAGR 2026-2035 - Market by Region | North India | 8.6% |
| CAGR 2026-2035 - Market by End Use | Visual Marketing | 10.3% |
| CAGR 2026-2035 - Market by Distribution Channel | Online Channels | 15.7% |
| 2025 Market Share by Region | South India | 20.7% |
India’s edtech industry, which is valued at over INR 15,000 crores is expected to grow at a CAGR of over 45% during the forecast period. In H1 2019, the industry received an investment of $100 million, which rose to $800 million year-on-year. Nearly 1.4 million schools, 51,000 colleges, and 300 million students in India depend on online education to fulfil their potential. Almost 65% of India’s population is aged between 12-29 years, of which nearly 7 million students use mobile phones for assignments and projects. Online test preparation platforms are expected to grow at a CAGR of 64%, with primary and secondary education (60% CAGR), language learning (42% CAGR), and higher education (41% CAGR) following closely. This is expected to increase the demand for good quality webcams embedded in laptops and mobile phones that ensure a seamless learning experience during live interactive classes, thereby driving market growth.
Live entertainment events have become increasingly popular in India. In 2022, nearly 8 million people attended over 19,000 events and live entertainment shows, as per Book My Show’s annual report. Companies like Paytm Insider witnessed a growth of 4 times in revenue and 2.5 times in the number of active users. This is expected to accelerate the demand for premium webcams that provide a seamless experience of entertainment to people, thereby driving market expansion.
India Webcam Market Report and Forecast 2026-2035 offers a detailed analysis of the market based on the following segments:
Market Breakup by Webcam Type
Market Breakup by Technology
Market Breakup by End Use
Market Breakup by Distribution Channel
Market Breakup by Region
| CAGR 2026-2035 - Market by | End Use |
| Visual Marketing | 10.3% |
| Video Conference | 9.2% |
| Security and Surveillance | XX% |
| Entertainment | XX% |
| Live Events | XX% |
| Others | XX% |
| CAGR 2026-2035 - Market by | Distribution Channel |
| Online Channels | 15.7% |
| Offline Stores | XX% |
| CAGR 2026-2035 - Market by | Region |
| East India | 9.4% |
| North India | 8.6% |
| West India and Central India | XX% |
| South India | XX% |
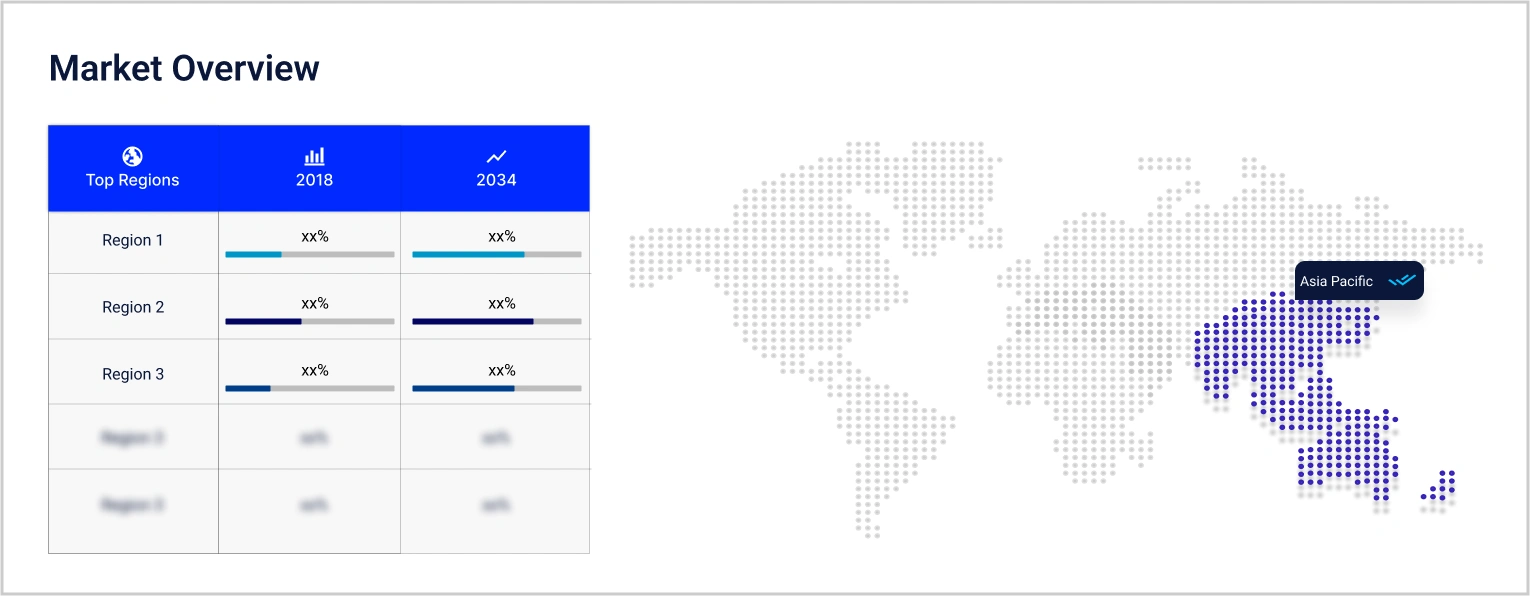
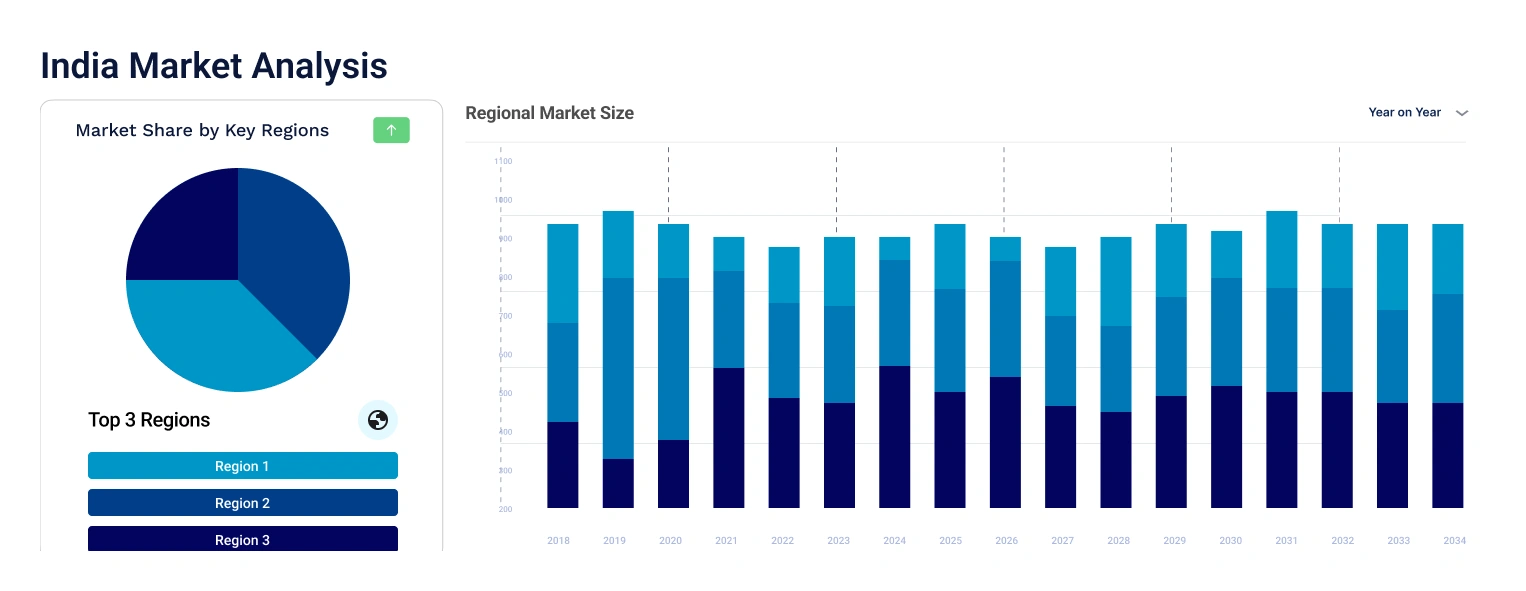
Based on region, the market is segmented into East India, West India and Central India, North India, and South India. South India is projected to dominate the market, representing 21% of the overall market share. Over the forecast period of 2026-2035, East India is assessed to grow at a CAGR of 9.4% due to increasing demand for security and surveillance cameras.
Major Indian companies are expected to introduce high-resolution webcam models, which provide superior low-light performance and are equipped with microphones and noise-cancellation features.


Upto 15% Off
USD
$2499 $2249
$3999 $3599
$4999 $4249
$5999 $5099


*While we strive to always give you current and accurate information, the numbers depicted on the website are indicative and may differ from the actual numbers in the main report. At Expert Market Research, we aim to bring you the latest insights and trends in the market. Using our analyses and forecasts, stakeholders can understand the market dynamics, navigate challenges, and capitalize on opportunities to make data-driven strategic decisions.*
Get in touch with us for a customized solution tailored to your unique requirements and save upto 35%!
The market reached nearly USD 278.34 Million in 2025.
The market is projected to grow at a CAGR of 9.00% between 2026 and 2035.
The market is assessed to witness healthy growth in the forecast period to reach around USD 658.93 Million in 2035.
The different types of webcams in the market are external webcam and embedded webcam.
The different segments based on the technologies of webcam considered in the market report include analogue and digital.
The different distribution channels of webcams in the market are online and offline.
The different regions covered in the market report are East India, West India and Central India, North India, and South India.
The key market players are Logitech S.A., Microsoft Corporation, Razer Inc., Creative Technology Ltd., HP Development Company, L.P., AVerMedia Technologies, Inc., Arashi Vision Inc., Lenovo Group Ltd., Dell, Inc., and Corsair Memory Inc., among others.
Explore our key highlights of the report and gain a concise overview of key findings, trends, and actionable insights that will empower your strategic decisions.
| REPORT FEATURES | DETAILS |
| Base Year | 2025 |
| Historical Period | 2019-2025 |
| Forecast Period | 2026-2035 |
| Scope of the Report |
Historical and Forecast Trends, Industry Drivers and Constraints, Historical and Forecast Market Analysis by Segment:
|
| Breakup by Webcam Type |
|
| Breakup by Technology |
|
| Breakup by End Use |
|
| Breakup by Distribution Channel |
|
| Breakup by Region |
|
| Market Dynamics |
|
| Competitive Landscape |
|
| Companies Covered |
|
Datasheet
One User
USD 2,499
USD 2,249
tax inclusive*
Single User License
One User
USD 3,999
USD 3,599
tax inclusive*
Five User License
Five User
USD 4,999
USD 4,249
tax inclusive*
Corporate License
Unlimited Users
USD 5,999
USD 5,099
tax inclusive*
*Please note that the prices mentioned below are starting prices for each bundle type. Kindly contact our team for further details.*
Flash Bundle
Small Business Bundle
Growth Bundle
Enterprise Bundle
*Please note that the prices mentioned below are starting prices for each bundle type. Kindly contact our team for further details.*
Flash Bundle
Number of Reports: 3
20%
tax inclusive*
Small Business Bundle
Number of Reports: 5
25%
tax inclusive*
Growth Bundle
Number of Reports: 8
30%
tax inclusive*
Enterprise Bundle
Number of Reports: 10
35%
tax inclusive*
How To Order

Select License Type
Choose the right license for your needs and access rights.

Click on ‘Buy Now’
Add the report to your cart with one click and proceed to register.

Select Mode of Payment
Choose a payment option for a secure checkout. You will be redirected accordingly.
Gain insights to stay ahead and seize opportunities.

Get insights & trends for a competitive edge.

Track prices with detailed trend reports.

Analyse trade data for supply chain insights.

Leverage cost reports for smart savings

Enhance supply chain with partnerships.

Connect For More Information
Our expert team of analysts will offer full support and resolve any queries regarding the report, before and after the purchase.
Our expert team of analysts will offer full support and resolve any queries regarding the report, before and after the purchase.
We employ meticulous research methods, blending advanced analytics and expert insights to deliver accurate, actionable industry intelligence, staying ahead of competitors.
Our skilled analysts offer unparalleled competitive advantage with detailed insights on current and emerging markets, ensuring your strategic edge.
We offer an in-depth yet simplified presentation of industry insights and analysis to meet your specific requirements effectively.


Share