

Consumer Insights
Uncover trends and behaviors shaping consumer choices today
Procurement Insights
Optimize your sourcing strategy with key market data
Industry Stats
Stay ahead with the latest trends and market analysis.

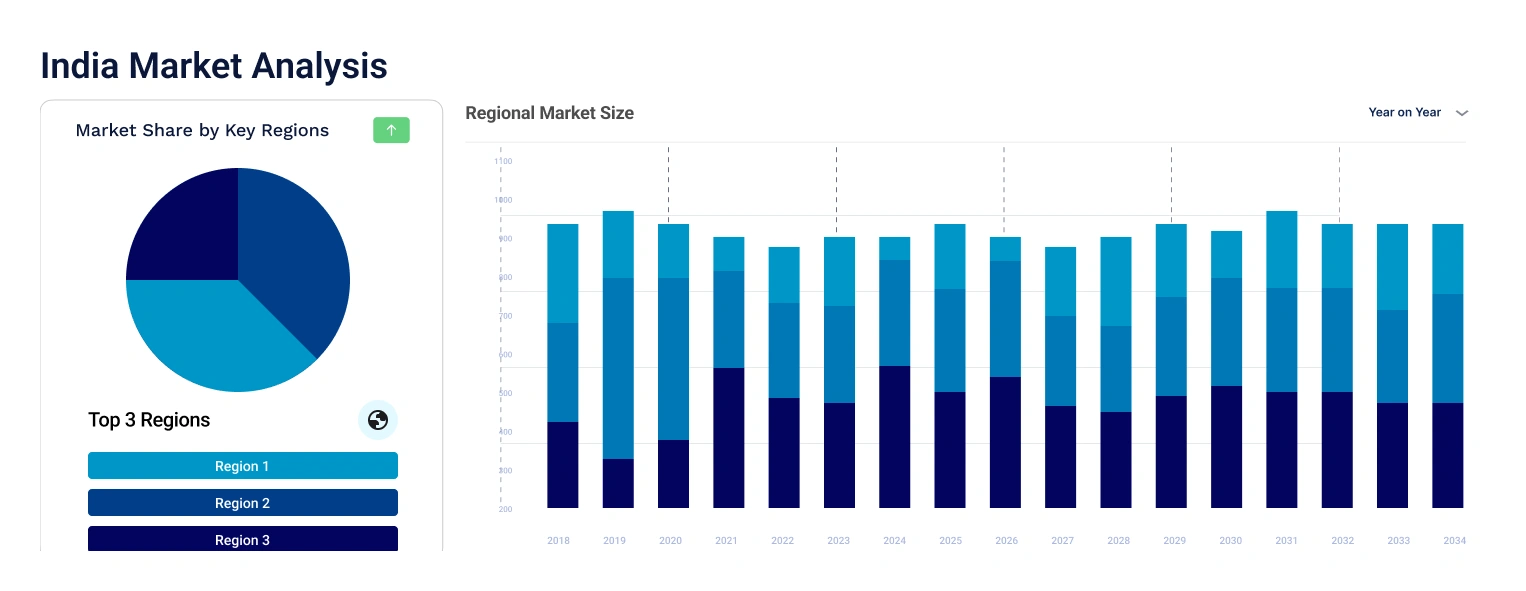
The India television market is projected to grow at a CAGR of 7.90% between 2026 and 2035.
Base Year
Historical Period
Forecast Period
The smart TV shipment in India has reached around 93 per cent of the overall TV shipments in 2024.
As per the industry reports, the television penetration in India stands at a level of 70 per cent with ample growth opportunities, due to the rising population.
Cloud TV, a pioneer of smart TV operating systems, announced a software update, Cloud 3.0, in May 2024, which can enhance the experience of affordable smart TVs.
Compound Annual Growth Rate
7.9%
2026-2035
*this image is indicative*
The growth of the media and entertainment sector, the rising popularity of streaming platforms such as Netflix and Amazon Prime, and the rising affordability of LED and LCD TVs are some of the prominent drivers boosting the India television market growth. With the growing prominence of technology such as 4K and 8K, manufacturers are readily focusing on the development of high-resolution TVs in the Indian market.
With the rapid growth of e-commerce and increased internet penetration, the online sales of TVs have witnessed an upward trend. Online channels further offer a wide range of brands, price ranges and features, drawing the attention of potential customers.
Market players are increasingly launching affordable smart TVs in the country to increase their market penetration. For instance, Xiaomi announced the launch of a 32-inch smart TV in May 2024, priced under Rs 15,000, and with a 4-star BEE certification, making it more cost-effective and eco-efficient compared to its previous models.
Several trends and developments are being observed in the market to enhance the current situation. Some of the noteworthy trends are as follows:
Rising disposable income encourages consumers to invest in high-end home entertainment products, raising the demand for high-end television. This includes televisions with 4K and 8K resolutions, larger screen sizes, and enhanced display technologies like QLED and OLED. Moreover, an increased purchasing power allows customers to use multiple television screens at home for the convenience of family members. According to the Press Information Bureau (PIB), the gross National Disposable Income (GNDI) at current prices in 2022-23 was estimated at INR 273.99 lakh crore a growth of 14.5 per since the previous year. Growing employment, industrialization, and urbanisation are expected to nudge the growth further, raising the demand for high-end television products in the country.
The growing popularity of Over-the-Top (OTT) platforms like Netflix, Amazon Prime, and Disney+ Hotstar is boosting the demand for TVs with integrated OTT connectivity features in India. OTT platforms offer a wide variety of content that can be watched on multiple large-screen and small-screen devices including televisions, through easy Bluetooth or Wifi connectivity. Realising their growing preference, key players are investing in the development of smart televisions with multiple technological advancements. For instance, LG Electronics, one of the largest electronic products suppliers in India, launched a new range of Smart TVs equipped with integrated Chromecast and Apple AirPlay, allowing customers to cast content from their devices to the large television screen. Such introductions are expected to provide a competitive edge for smart televisions in the market.
The integration of home theatre systems in luxury homes has raised the demand for premium quality, ultra-large screen televisions with high-quality audio systems to provide an immersive cinematic experience to users, eliminating the need for visiting cinematic theatres for the same. Eyeing high-profit margins, industry leaders are introducing these products in the Indian television market, especially targeting high-income consumers in the run. Sony launched BRAVIA Theatre-U, a home theatre system in September 2024, which can easily be connected to Bravia TVs, providing vibrant 4K HDR imagery and an immersive sound experience. Such launches are expected to boost the revenue of the Indian television market in the long term.
Integrated technological features in televisions are reshaping the development of the television industry in India. These primarily include AI-based features and Google TV. While AI integration allows TVs to recommend content based on viewing habits, optimize picture quality in real-time, and support voice-activated controls through virtual assistants like Google Assistant or Alexa, Google TV's seamless integration with the Google ecosystem enhances smart home compatibility, delivering a user-friendly interface for accessing content and apps. For instance, the newly launched Google TV Streamer 4K in August 2024, throughout the world, including India, has enhanced the productivity of the Indian television market. The Google TV is also equipped with Google AI features that offer personalised recommendations, and easy access to detailed summaries, reviews, and season breakdowns, enabling users to create personalised watchlists for each family member.
“India Television Market Report and Forecast 2026-2035” offers a detailed analysis of the market based on the following segments:
Market Breakup by Type
Market Breakup by Distribution Channel
Market Breakup by Region
Based on type, the market is divided into smart TV, LCD, plasma, and LED TVs, and cathode-ray tube (CRT) and rear-projection TVs. Smart TVs are experiencing rapid growth in the Indian market as the demand for QLED TVs grows marginally. The shift in consumer preference towards large-size TVs (55 inches and above) along with the rising popularity of streaming services and availability of pre-installed streaming apps such as Netflix, Disney Plus, and Amazon Prime has further aided the segment growth.
The market participants are readily launching affordable and high-end smart TVs to gain a competitive edge in the market.
Ultra HD Television (UHD TV) Market
North America Television Market
United States Television Market
South Korea Television Market
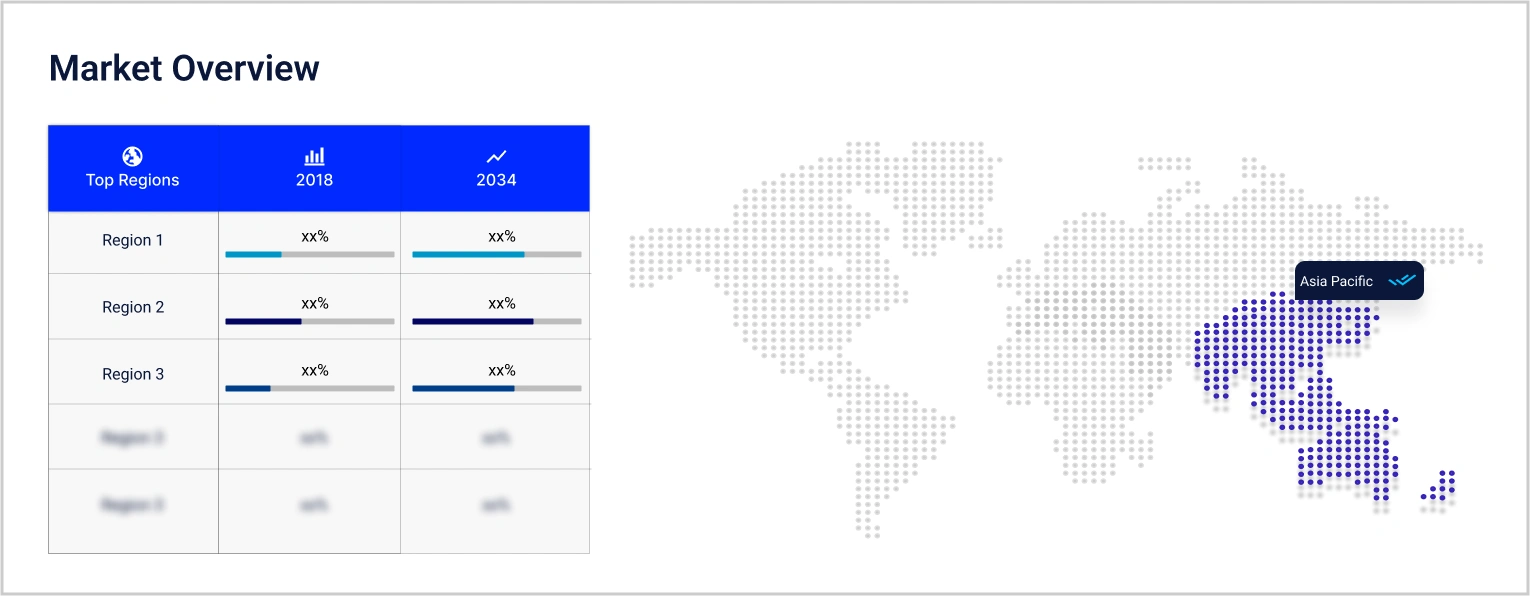
Asia Pacific Television Market
Television Services Market
Canada Television Market
Europe Television Market
Social Television Market
Television Market


Upto 15% Off
USD
$2499 $2249
$3999 $3599
$4999 $4249
$5999 $5099


*While we strive to always give you current and accurate information, the numbers depicted on the website are indicative and may differ from the actual numbers in the main report. At Expert Market Research, we aim to bring you the latest insights and trends in the market. Using our analyses and forecasts, stakeholders can understand the market dynamics, navigate challenges, and capitalize on opportunities to make data-driven strategic decisions.*
Get in touch with us for a customized solution tailored to your unique requirements and save upto 35%!
The market is estimated to grow at a CAGR of 7.90% between 2026 and 2035.
The market is being driven due to growth of the media and entertainment sector, the rising popularity of streaming platforms such as Netflix and Amazon Prime, and the rising affordability of LED and LCD TVs.
The key trends aiding the market include the rapid growth of e-commerce, the rising launch of affordable smart TVs, and growth of the OLED technology.
Regions considered in the market are North India, East and Central India, West India, and South India.
Based on type, market segmentations include smart TV, LCD, plasma, and LED TVs, and cathode-Ray tube (CRT) and rear-projection TVs.
Different distribution channels are offline and online.
Smart TVs depict the highest growth potential in the Indian market.
The major players in the market are Samsung Electronics Co., Ltd., LG Corp., Panasonic Holdings Corp., Sony Group Corp., Toshiba Corporation, Hisense International Co., Ltd., Haier Smart Home Co. Ltd., Micromax Informatics Ltd., Sansui Electric Co., Ltd., and Vizio Holding Corp., among others.
Explore our key highlights of the report and gain a concise overview of key findings, trends, and actionable insights that will empower your strategic decisions.
| REPORT FEATURES | DETAILS |
| Base Year | 2025 |
| Historical Period | 2019-2025 |
| Forecast Period | 2026-2035 |
| Scope of the Report |
Historical and Forecast Trends, Industry Drivers and Constraints, Historical and Forecast Market Analysis by Segment:
|
| Breakup by Type |
|
| Breakup by Distribution Channel |
|
| Breakup by Region |
|
| Market Dynamics |
|
| Competitive Landscape |
|
| Companies Covered |
|
Datasheet
One User
USD 2,499
USD 2,249
tax inclusive*
Single User License
One User
USD 3,999
USD 3,599
tax inclusive*
Five User License
Five User
USD 4,999
USD 4,249
tax inclusive*
Corporate License
Unlimited Users
USD 5,999
USD 5,099
tax inclusive*
*Please note that the prices mentioned below are starting prices for each bundle type. Kindly contact our team for further details.*
Flash Bundle
Small Business Bundle
Growth Bundle
Enterprise Bundle
*Please note that the prices mentioned below are starting prices for each bundle type. Kindly contact our team for further details.*
Flash Bundle
Number of Reports: 3
20%
tax inclusive*
Small Business Bundle
Number of Reports: 5
25%
tax inclusive*
Growth Bundle
Number of Reports: 8
30%
tax inclusive*
Enterprise Bundle
Number of Reports: 10
35%
tax inclusive*
How To Order

Select License Type
Choose the right license for your needs and access rights.

Click on ‘Buy Now’
Add the report to your cart with one click and proceed to register.

Select Mode of Payment
Choose a payment option for a secure checkout. You will be redirected accordingly.
Gain insights to stay ahead and seize opportunities.

Get insights & trends for a competitive edge.

Track prices with detailed trend reports.

Analyse trade data for supply chain insights.

Leverage cost reports for smart savings

Enhance supply chain with partnerships.

Connect For More Information
Our expert team of analysts will offer full support and resolve any queries regarding the report, before and after the purchase.
Our expert team of analysts will offer full support and resolve any queries regarding the report, before and after the purchase.
We employ meticulous research methods, blending advanced analytics and expert insights to deliver accurate, actionable industry intelligence, staying ahead of competitors.
Our skilled analysts offer unparalleled competitive advantage with detailed insights on current and emerging markets, ensuring your strategic edge.
We offer an in-depth yet simplified presentation of industry insights and analysis to meet your specific requirements effectively.


Share