

Consumer Insights
Uncover trends and behaviors shaping consumer choices today
Procurement Insights
Optimize your sourcing strategy with key market data
Industry Stats
Stay ahead with the latest trends and market analysis.

The India mobile payment market reached USD 2.44 Trillion in 2025. The market is projected to grow at a CAGR of 25.20% between 2026 and 2035, reaching almost USD 23.09 Trillion by 2035.
Base Year
Historical Period
Forecast Period
Paytm, Google Pay, and PhonePe account for over 90% of all transactions by value and volume in India.
In February 2024, 122 crore transactions worth RS. 18.2 lakh through UPI were recorded in India.
Remote proximity is expected to constitute a major portion of the market share.
Compound Annual Growth Rate
25.2%
Value in USD Trillion
2026-2035
*this image is indicative*
| India Mobile Payment Market Report Summary | Description | Value |
| Base Year | USD Trillion | 2025 |
| Historical Period | USD Trillion | 2019-2025 |
| Forecast Period | USD Trillion | 2026-2035 |
| Market Size 2025 | USD Trillion | 2.44 |
| Market Size 2035 | USD Trillion | 23.09 |
| CAGR 2019-2025 | Percentage | XX% |
| CAGR 2026-2035 | Percentage | 25.20% |
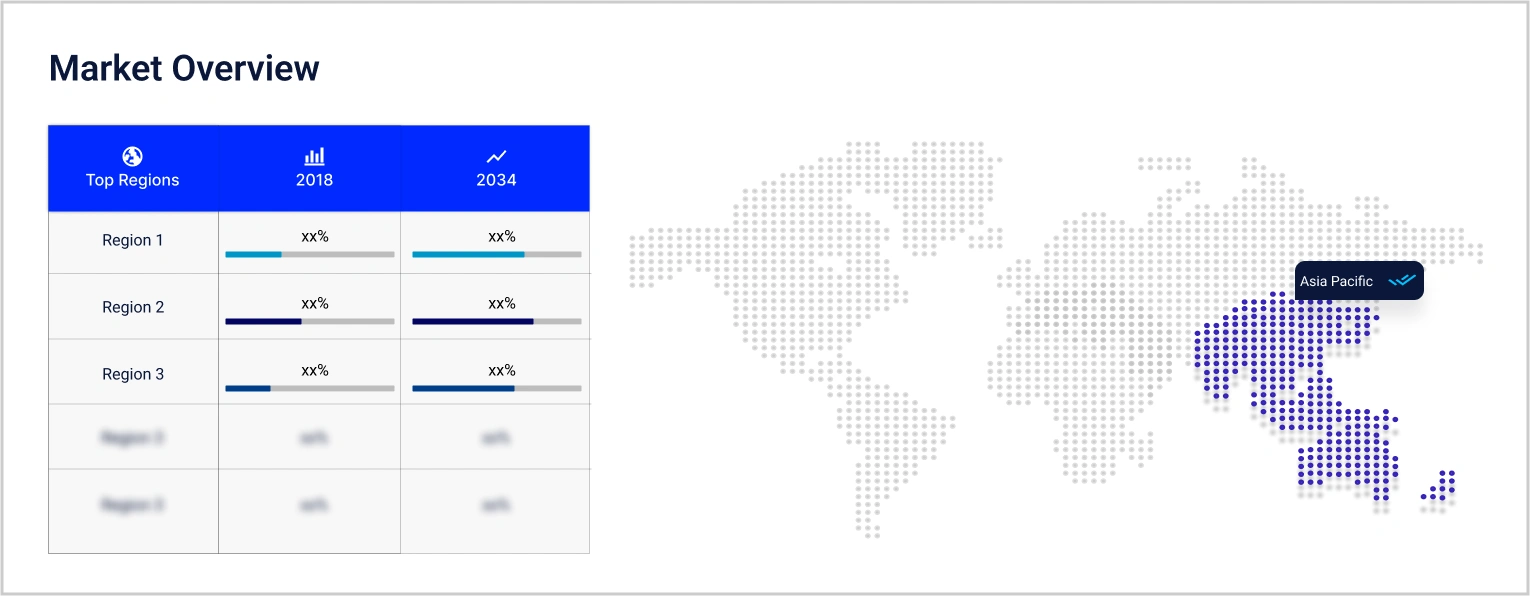
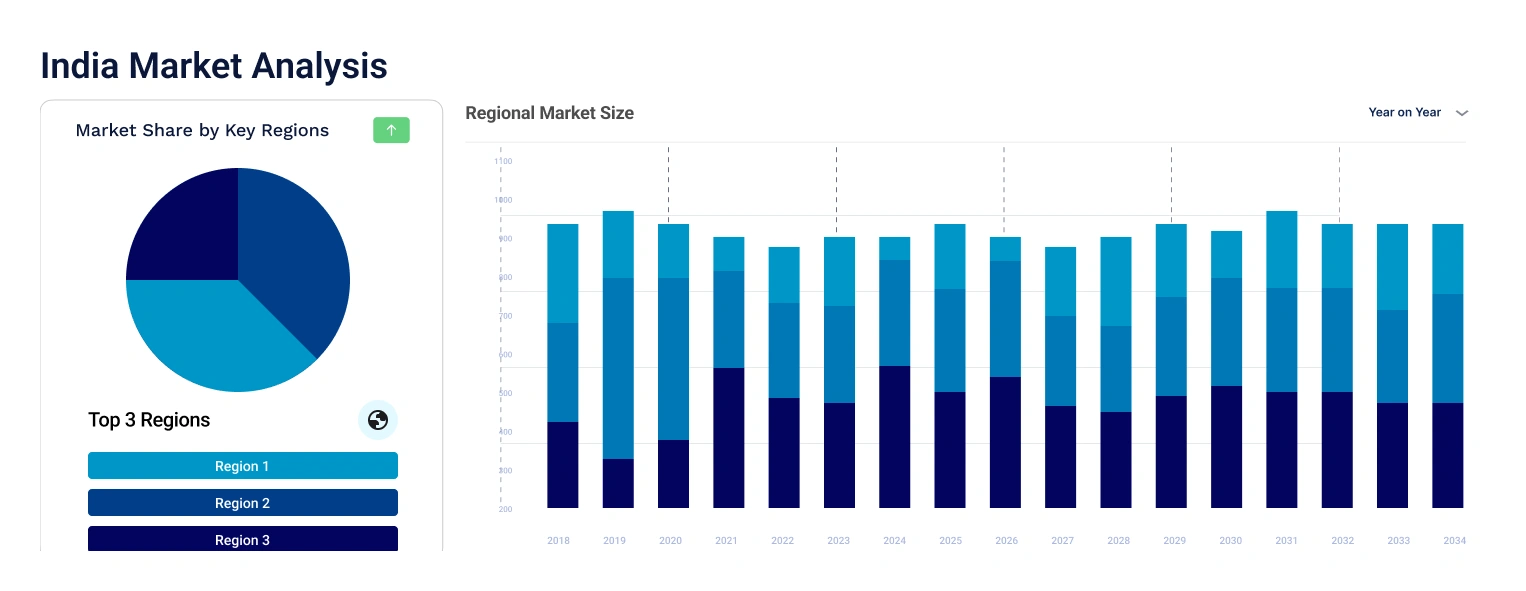
| CAGR 2026-2035 - Market by Region | North India | 28.7% |
| CAGR 2026-2035 - Market by Region | East and Central India | 26.0% |
| CAGR 2026-2035 - Market by Payment Type | B2C | 28.2% |
| CAGR 2026-2035 - Market by End Use | Retail and E-Commerce | 28.7% |
| Market Share by Region | North India | 32.7% |
The Reserve Bank of India is expected to introduce the facility of cash deposits in banks through the Unified Payments Interface (an instant payments platform developed by NPCI). This is expected to accelerate market development in the forecast period.
The National Payments Corporation of India is also assisting emerging fintech companies in promoting the usage of their digital apps for UPI transactions. This is expected to increase the India mobile payment market value.
The volume of digital payments has recorded an annual growth rate of 50% in India, the highest in the world. The number of transactions reached 5.86 billion in June 2022, while the number of banks providing instant money transfer services on mobiles recorded a y-o-y increase of 44%. To further the scope of financial accessibility, the RBI introduced a UPI facility for feature phones. This is expected to enable 400 million rural people to adopt digital payments, thereby aiding the India mobile payment market expansion.
Increasing government attention on curbing terrorist financing, corruption, and illegal money laundering through measures such as demonetisation is expected to increase the adoption of digital payments. As per India mobile payment market dynamics and trends, enhanced security measures such as biometric verification are expected to build consumer confidence and lead to the market growth in upcoming years.
As per the India mobile payment industry analysis, the trend of luxury shopping is gradually becoming more popular in India's retail sector. Established businesses in India, like Darveys, have emerged as the new upscale shelter for fashion buyers as travel has become more restricted and offline shopping has lost its appeal. Luxury online players have seen a rise in sales as a result of consumers switching from offline to online purchasing; they continue to be open to exploring new avenues for obtaining rare and luxurious items. For example, the Indian e-commerce sector is predicted by India brand Equity Foundation (IBEF) to reach USD 200 billion by 2026. Digitally educated Indian consumers have an intense desire for foreign goods and brands, placing large orders for sophisticated computerized warehouses to manage the influx of more generic commodities. Such a rise in online shopping is expected to drive the demand of India mobile payment market.
Over the past five years, India's digital payment volume has increased at an average annual rate of almost 50%. Since National Payments Corporation of India (NPCI) launched UPI (Unified Payments Interface) in 2016, the country has experienced a considerable increase in its use. With nearly INR 4.3 trillion worth of transactions conducted by December 2020, UPI saw a YoY rise of 63% in 2020. With more than 1.49 billion transactions valued INR 5.6 trillion completed in June 2021, the YoY growth in 2021 was 72%. According to the NPCI, UPI's total transaction value at the end of the 2022 calendar year was INR 125.95 trillion, an increase of 1.75% year over year (YoY), thus increasing the India mobile payment industry revenue. It's interesting to note that in FY22, the entire amount of UPI transactions represented almost 86% of India's GDP. The total amount of transactions made through UPI as of the end of 2023 is 83.75 billion.
Leading international provider of technology-driven services, Lytus Technologies Holdings PTV. Ltd., introduced its payments gateway for Indian customers in July 2023. The company's strategic goal of increasing its market share in India by providing a range of services to Indian customers is being furthered by the deployment of the payment gateway. Initially, the new payment gateway will make transactions easier for Lytus customers who use IPTV and broadband services.
Razorpay, the top full-stack payments and banking platform in India for businesses, stated in December 2022 that it is now equipped to handle credit card transactions using the Unified Payments Interface (UPI). With its debut, Razorpay becomes the first payment gateway in India to accept credit cards using UPI. Customers of Indian Bank, Union Bank, Punjab National Bank, and HDFC Bank would be the first to benefit from this innovation as of right now. This product aligns with the Reserve Bank of India's (RBI) and the National Payments Corporation of India's (NPCI) most recent digital innovation. Every day, almost 250 million Indians utilize UPI for their transactions, and 50 million of those users hold one or more credit cards.
India Mobile Payment Market Report and Forecast 2026-2035 offers a detailed analysis of the market based on the following segments:
Market Breakup by Technology
Market Breakup by Payment Type
Market Breakup by Location
Market Breakup by End Use
Market Breakup by Region
| CAGR 2026-2035 - Market by | Region |
| North India | 28.7% |
| East and Central India | 26.0% |
| South India | XX% |
| West India | XX% |
The key players in the mobile payment market in India are Alphabet Inc., Walmart Inc. (PhonePe), Amazon.com Inc., One 97 Communications Ltd. (Paytm), Samsung Electronics Co. Ltd., ICICI Bank Ltd., PayPal Holdings Inc., Apple Inc., Meta Platforms Inc., HDFC Bank Ltd., and Visa Inc., among others.


Upto 15% Off
USD
$2499 $2249
$3999 $3599
$4999 $4249
$5999 $5099


*While we strive to always give you current and accurate information, the numbers depicted on the website are indicative and may differ from the actual numbers in the main report. At Expert Market Research, we aim to bring you the latest insights and trends in the market. Using our analyses and forecasts, stakeholders can understand the market dynamics, navigate challenges, and capitalize on opportunities to make data-driven strategic decisions.*
Get in touch with us for a customized solution tailored to your unique requirements and save upto 35%!
The market was valued at nearly USD 2.44 Trillion in 2025.
The market is projected to grow at a CAGR of 25.20% between 2026 and 2035.
The market is assessed to witness a healthy growth in the forecast period to reach around USD 23.09 Trillion in 2035.
The different technologies used for mobile payment include direct mobile billing, near field communication, mobile web payment, SMS, and mobile application, among others.
The different payment types in the market include B2B, B2C, and B2G.
The major regions in the market include North India, East and Central India, West India, and South India.
The key market players are Alphabet Inc., Walmart Inc. (PhonePe), Amazon.com Inc., One 97 Communications Ltd. (Paytm), Samsung Electronics Co. Ltd., ICICI Bank Ltd., PayPal Holdings Inc., Apple Inc., Meta Platforms Inc., HDFC Bank Ltd., and Visa Inc., among others.
Explore our key highlights of the report and gain a concise overview of key findings, trends, and actionable insights that will empower your strategic decisions.
| REPORT FEATURES | DETAILS |
| Base Year | 2025 |
| Historical Period | 2019-2025 |
| Forecast Period | 2026-2035 |
| Scope of the Report |
Historical and Forecast Trends, Industry Drivers and Constraints, Historical and Forecast Market Analysis by Segment:
|
| Breakup by Technology |
|
| Breakup by Payment Type |
|
| Breakup by Location |
|
| Breakup by End Use |
|
| Breakup by Region |
|
| Market Dynamics |
|
| Competitive Landscape |
|
| Companies Covered |
|
Datasheet
One User
USD 2,499
USD 2,249
tax inclusive*
Single User License
One User
USD 3,999
USD 3,599
tax inclusive*
Five User License
Five User
USD 4,999
USD 4,249
tax inclusive*
Corporate License
Unlimited Users
USD 5,999
USD 5,099
tax inclusive*
*Please note that the prices mentioned below are starting prices for each bundle type. Kindly contact our team for further details.*
Flash Bundle
Small Business Bundle
Growth Bundle
Enterprise Bundle
*Please note that the prices mentioned below are starting prices for each bundle type. Kindly contact our team for further details.*
Flash Bundle
Number of Reports: 3
20%
tax inclusive*
Small Business Bundle
Number of Reports: 5
25%
tax inclusive*
Growth Bundle
Number of Reports: 8
30%
tax inclusive*
Enterprise Bundle
Number of Reports: 10
35%
tax inclusive*
How To Order

Select License Type
Choose the right license for your needs and access rights.

Click on ‘Buy Now’
Add the report to your cart with one click and proceed to register.

Select Mode of Payment
Choose a payment option for a secure checkout. You will be redirected accordingly.
Gain insights to stay ahead and seize opportunities.

Get insights & trends for a competitive edge.

Track prices with detailed trend reports.

Analyse trade data for supply chain insights.

Leverage cost reports for smart savings

Enhance supply chain with partnerships.

Connect For More Information
Our expert team of analysts will offer full support and resolve any queries regarding the report, before and after the purchase.
Our expert team of analysts will offer full support and resolve any queries regarding the report, before and after the purchase.
We employ meticulous research methods, blending advanced analytics and expert insights to deliver accurate, actionable industry intelligence, staying ahead of competitors.
Our skilled analysts offer unparalleled competitive advantage with detailed insights on current and emerging markets, ensuring your strategic edge.
We offer an in-depth yet simplified presentation of industry insights and analysis to meet your specific requirements effectively.


Share