

Consumer Insights
Uncover trends and behaviors shaping consumer choices today
Procurement Insights
Optimize your sourcing strategy with key market data
Industry Stats
Stay ahead with the latest trends and market analysis.
The India household care market reached approximately USD 8.71 Billion in 2024. The market is projected to grow at a CAGR of 14.80% between 2025 and 2034, reaching a value of around USD 34.63 Billion by 2034.
Base Year
Historical Period
Forecast Period


Value in USD Billion
2025-2034
India Household Care Market Outlook
*this image is indicative*
| India Household Care Market Report Summary | Description | Value |
| Base Year | USD Billion | 2024 |
| Historical Period | USD Billion | 2018-2024 |
| Forecast Period | USD Billion | 2025-2034 |
| Market Size 2024 | USD Billion | 8.71 |
| Market Size 2034 | USD Billion | 30.16 |
| CAGR 2018-2024 | Percentage | XX% |
| CAGR 2025-2034 | Percentage | 14.8% |
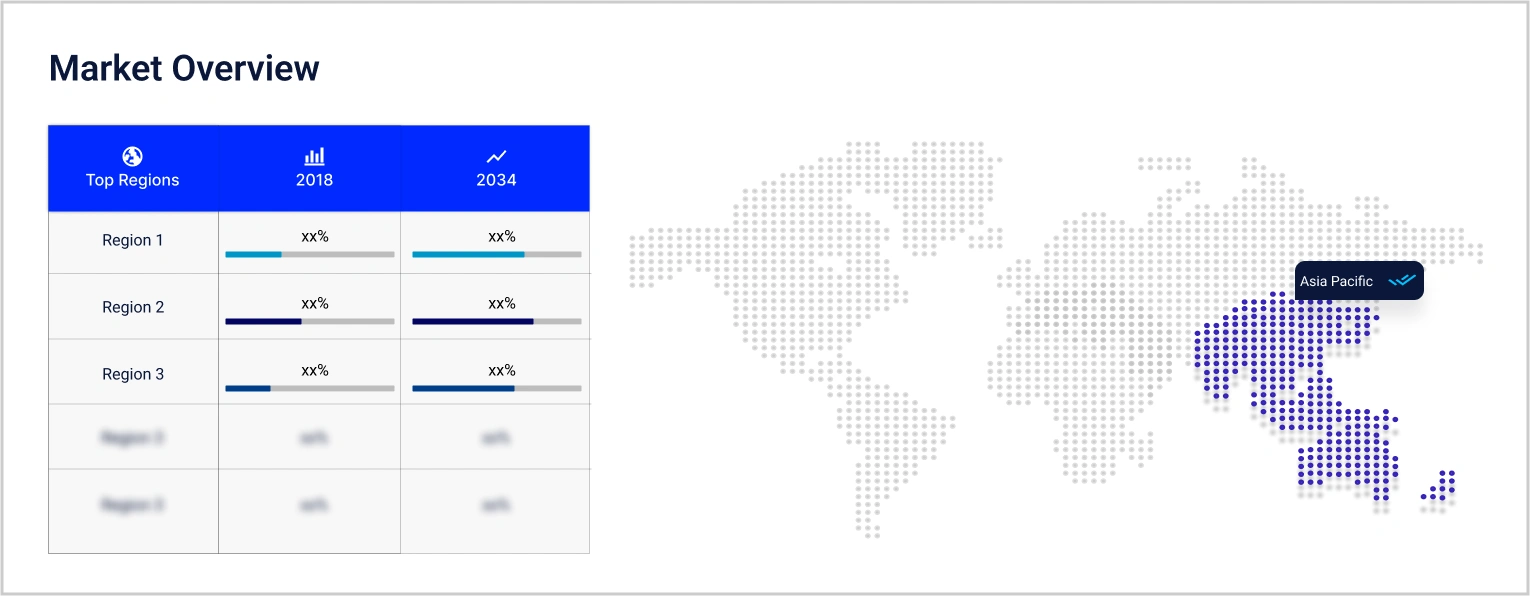
| CAGR 2025-2034 - Market by Region | West India and Central India | 15.7% |
| CAGR 2025-2034 - Market by Region | North India | 14.2% |
| CAGR 2025-2034 - Market by Products | Laundry Additives | 16.0% |
| CAGR 2025-2034 - Market by Distribution Channel | Online Channels | 19.3% |
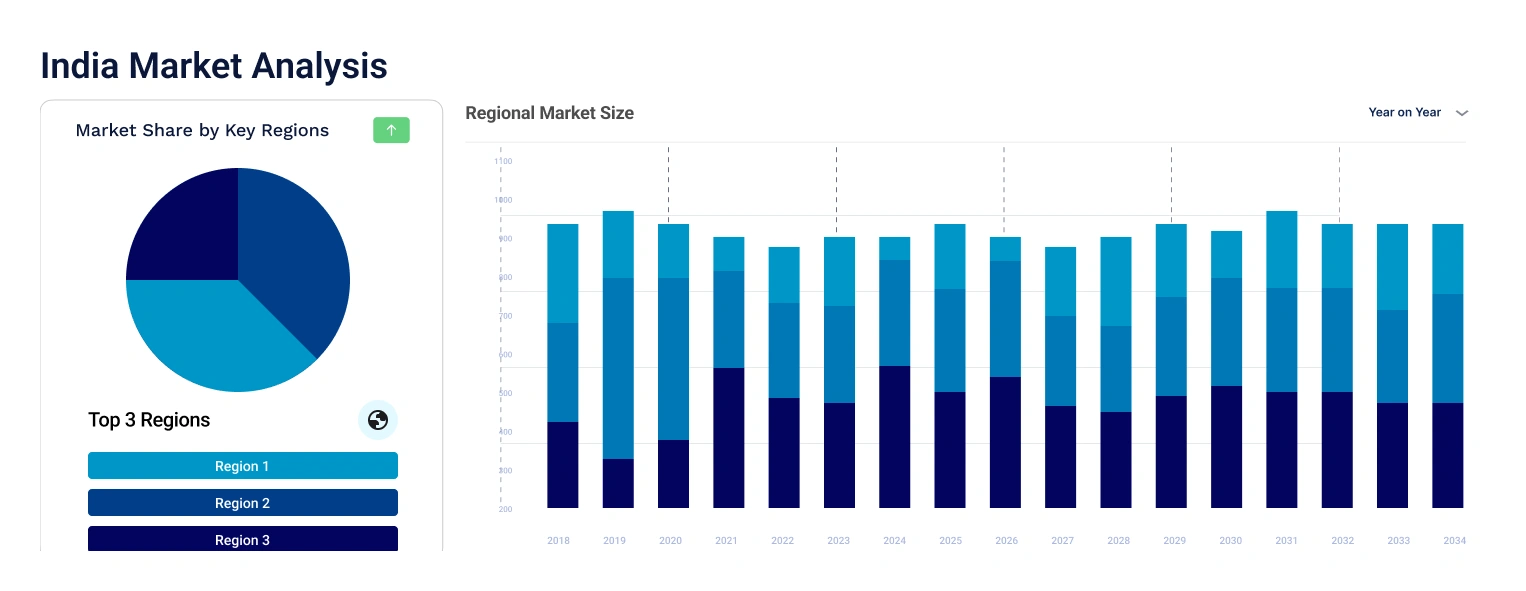
| 2024 Market Share by Region | South India | 18.6% |
It is projected that 590 million people will reside in Indian cities by 2030. The rapid urbanisation has resulted in busier lifestyles among city dwellers, leading to a greater reliance on convenient and efficient household care solutions. Additionally, the rise in disposable income among Indian consumers has contributed to increased spending on household care products. Disposable personal income in India saw an increase to 296,383,300 INR million in 2023 from 273,364,818.90 INR million in 2022. With more individuals transitioning into the middle and upper-middle-income brackets, their purchasing power has grown, allowing them to invest in premium household care products.
The rise in consciousness regarding environmental and health issues has resulted in a higher demand for sustainable and environmentally friendly disinfectants. For instance, in 2021, HydroCleaner, an eco-friendly cleaning and disinfectant product, was introduced to the market in Telangana. These disinfectants are formulated to efficiently eradicate pathogens while reducing their environmental footprint.
Public awareness has been heightened and the use of household care products has increased due to government campaigns like the Swachh Bharat Abhiyan (Clean India Mission) that promote cleanliness and hygiene.
The market has seen substantial growth, largely due to the proliferation of online platforms. India's e-commerce revenues are projected to increase from $46.2 billion in 2020 to $136.47 billion by 2026. The emergence of e-commerce has revolutionised the shopping experience for consumers of household care items, providing them with convenience, a wide range of choices, and easy access.
“India Household Care Market Report and Forecast 2025-2034” offers a detailed analysis of the market based on the following segments:
Market Breakup by Products:
Market Breakup by Distribution Channel:
Market Breakup by Region:
| CAGR 2025-2034 - Market by | Region |
| West India and Central India | 15.7% |
| North India | 14.2% |
| East India | XX% |
| South India | XX% |
Based on distribution channels, the market is segmented into supermarkets and hypermarkets, convenience stores, and online, among others. The online segment is projected to grow at a CAGR of 19.3%% during the forecast period of 2025-2034.The popularity of online distribution for household care products has risen significantly due to the convenience and accessibility it provides to consumers. This distribution method utilises a variety of channels such as major e-commerce platforms, direct-to-consumer websites, subscription services, social media, online grocery stores, and B2B platforms.
The market players are focusing on the production of sustainable and eco-friendly products to gain a competitive edge in the market.
*While we strive to always give you current and accurate information, the numbers depicted on the website are indicative and may differ from the actual numbers in the main report. At Expert Market Research, we aim to bring you the latest insights and trends in the market. Using our analyses and forecasts, stakeholders can understand the market dynamics, navigate challenges, and capitalize on opportunities to make data-driven strategic decisions.*
Get in touch with us for a customized solution tailored to your unique requirements and save upto 35%!
In 2024, the market reached an approximate value of USD 8.71 Billion.
The market is estimated to grow at a CAGR of 14.80% between 2025 and 2034.
The market is estimated to witness a healthy growth during 2025-2034 to reach around USD 34.63 Billion by 2034.
The market is being driven by the high disposable income, rapid urbanisation, and the growth of the e-commerce sector.
The key trends aiding the market expansion include the growing adoption of sustainable household care products and rising hygiene consciousness among consumers.
The major regions considered in the market are East India, West India and Central India, North India, and South India.
The different distribution channels include hypermarkets/supermarkets, convenience stores, and online, among others.
The major players in the market are Unilever plc, Procter & Gamble Company, Reckitt Benckiser Group Plc, Godrej Consumer Products Limited, Dabur India Ltd., Jyothy Laboratories Ltd., ITC Limited, Nirma Limited, Marico Ltd., and Emami Ltd., among others.
Explore our key highlights of the report and gain a concise overview of key findings, trends, and actionable insights that will empower your strategic decisions.
| REPORT FEATURES | DETAILS |
| Base Year | 2024 |
| Historical Period | 2018-2024 |
| Forecast Period | 2025-2034 |
| Scope of the Report |
Historical and Forecast Trends, Industry Drivers and Constraints, Historical and Forecast Market Analysis by Segment:
|
| Breakup by Products |
|
| Breakup by Distribution Channel |
|
| Breakup by Region |
|
| Market Dynamics |
|
| Competitive Landscape |
|
| Companies Covered |
|
Datasheet
One User
USD 2,499
USD 2,249
tax inclusive*
Single User License
One User
USD 3,999
USD 3,599
tax inclusive*
Five User License
Five User
USD 4,999
USD 4,249
tax inclusive*
Corporate License
Unlimited Users
USD 5,999
USD 5,099
tax inclusive*
*Please note that the prices mentioned below are starting prices for each bundle type. Kindly contact our team for further details.*
Flash Bundle
Small Business Bundle
Growth Bundle
Enterprise Bundle
*Please note that the prices mentioned below are starting prices for each bundle type. Kindly contact our team for further details.*
Flash Bundle
Number of Reports: 3
20%
tax inclusive*
Small Business Bundle
Number of Reports: 5
25%
tax inclusive*
Growth Bundle
Number of Reports: 8
30%
tax inclusive*
Enterprise Bundle
Number of Reports: 10
35%
tax inclusive*
How To Order
Our step-by-step guide will help you select, purchase, and access your reports swiftly, ensuring you get the information that drives your decisions, right when you need it.

Select License Type
Choose the right license for your needs and access rights.

Click on ‘Buy Now’
Add the report to your cart with one click and proceed to register.

Select Mode of Payment
Choose a payment option for a secure checkout. You will be redirected accordingly.
Track prices with detailed trend reports.

Analyse trade data for supply chain insights.

Leverage cost reports for smart savings

Enhance supply chain with partnerships.

Gain insights to stay ahead and seize opportunities.

Get insights & trends for a competitive edge.

Track prices with detailed trend reports.
Analyse trade data for supply chain insights.
Leverage cost reports for smart savings
Enhance supply chain with partnerships.
Gain insights to stay ahead and seize opportunities.
Get insights & trends for a competitive edge.
Track prices with detailed trend reports.
Analyse trade data for supply chain insights.
Connect For More Information
Our expert team of analysts will offer full support and resolve any queries regarding the report, before and after the purchase.
Our expert team of analysts will offer full support and resolve any queries regarding the report, before and after the purchase.
We employ meticulous research methods, blending advanced analytics and expert insights to deliver accurate, actionable industry intelligence, staying ahead of competitors.
Our skilled analysts offer unparalleled competitive advantage with detailed insights on current and emerging markets, ensuring your strategic edge.
We offer an in-depth yet simplified presentation of industry insights and analysis to meet your specific requirements effectively.
Australia
63 Fiona Drive, Tamworth, NSW
+61-448-061-727
India
C130 Sector 2 Noida, Uttar Pradesh 201301
+91-723-689-1189
Philippines
40th Floor, PBCom Tower, 6795 Ayala Avenue Cor V.A Rufino St. Makati City,1226.
+63-287-899-028, +63-967-048-3306
United Kingdom
6 Gardner Place, Becketts Close, Feltham TW14 0BX, Greater London
+44-753-713-2163
United States
30 North Gould Street, Sheridan, WY 82801
+1-415-325-5166
Vietnam
193/26/4 St.no.6, Ward Binh Hung Hoa, Binh Tan District, Ho Chi Minh City
+84-865-399-124
United States (Head Office)
30 North Gould Street, Sheridan, WY 82801
+1-415-325-5166
Australia
63 Fiona Drive, Tamworth, NSW
+61-448-061-727
India
C130 Sector 2 Noida, Uttar Pradesh 201301
+91-723-689-1189
Philippines
40th Floor, PBCom Tower, 6795 Ayala Avenue Cor V.A Rufino St. Makati City, 1226.
+63-287-899-028, +63-967-048-3306
United Kingdom
6 Gardner Place, Becketts Close, Feltham TW14 0BX, Greater London
+44-753-713-2163
Vietnam
193/26/4 St.no.6, Ward Binh Hung Hoa, Binh Tan District, Ho Chi Minh City
+84-865-399-124


Share