


Consumer Insights
Uncover trends and behaviors shaping consumer choices today
Procurement Insights
Optimize your sourcing strategy with key market data
Industry Stats
Stay ahead with the latest trends and market analysis.

The India fish market size was valued at INR 2073.79 Billion in 2025. The industry is expected to grow at a CAGR of 10.20% during the forecast period of 2026-2035 to reach a valuation of INR 5477.48 Billion by 2035.
The India fish market value is increasing on account of inflating disposable incomes and changing food habits. The consumption of sea food is expected to increase over the forecast period. India is the third largest fish producing country, contributing 8% to the global fish production. In recent years, India has witnessed huge growth both in domestic consumption, as well as the export of fish, consequently enhancing the overall market growth.
According to the Ministry of Fisheries, Animal Husbandry & Dairying, India's fish production totaled 16.24 million tonnes, with 4.12 million tonnes from marine sources and 12.12 million tonnes from aquaculture. Since the launch of the Pradhan Mantri Matsya Sampada Yojana (PMMSY) in 2020-21, the country's overall fish production has increased, reaching 16.24 million tonnes in 2021-22, up from 14.16 million tonnes in 2019-20.
The expansion of the cold chain logistics is also a crucial factor propelling the India fish market development. This expansion has facilitated the storage and transportation of frozen fish and increased their availability in urban areas, where convenient and frozen food products are gaining popularity due to busy lifestyles.
As per the India fish market analysis, the HoReCa (Hotels, Restaurants, and Catering) sector contributes over USD 78 billion annually to India's economy, representing more than 7 percent of the GDP. Projections suggest the industry will exceed USD 280 billion by 2025. Implementing effective government policies and regulations for the unorganized sector could significantly boost the potential of the HoReCa industry, fostering further economic growth and stability.
Base Year
Historical Period
Forecast Period
India is one of the third largest fish producing countries in the world.
Brackish water shrimp aquaculture has experienced significant growth in India, contributing to major export share.
Andhra Pradesh is one of the largest fish-producing states in India.
Compound Annual Growth Rate
10.2%
Value in INR Billion
2026-2035
*this image is indicative*
Fish, being a healthy food with high levels of digestible protein, cholesterol-lowering capability, and PUFA, is witnessing strong demand, especially from the health-conscious consumers and those following a certain diet. Sea food is rich in nutrients such as protein, omega-3 fatty acids, vitamins, and minerals, among others, which can support the overall health of a person. Omega-3 can reduce the risk of cardiovascular diseases, and Alzheimer’s disease and is good for skin and hair health. Furthermore, increasing consumption of fish is also linked to reducing stress and depression due to the presence of these fatty acids which can promote brain health.
The growth of the organised food retail sector has helped enhance the accessibility of processed fish products, especially canned and frozen fish products in the India fish market. ITC’s frozen food brand, Master Chef, has seen significant success in the Indian market, especially with products like frozen fish fingers and fillets. These products have been embraced by consumers due to their convenience and the premium quality offered by the brand.
The players in India fish market are incorporating sustainable practices to protect the biodiversity in the ocean and freshwater and meet the stringent quality and safety standards. India plans to increase its seafood exports from USD 8 billion to USD 12 billion over the next two years, focusing on high-end markets such as the United States and Europe. Shrimp farming, employing around 200,000 workers, mostly women in Andhra Pradesh, is a major contributor to this growth. The strategy includes focusing on value addition and promoting good labour and environmental practices.
Government initiatives including subsidies and incentives are promoting the aquaculture sector and boosting overall fish production, thus boosting the growth of the India fish market. One of the flagship initiatives by the Indian government is the Pradhan Mantri Matsya Sampada Yojana (PMMSY), launched in 2020. By 2024–2025, PMMSY aims to increase fish production by an additional 70 lakh tonnes, boost fisheries export revenue to Rs. 1,00,000 crores, double the incomes of fishers and fish farmers, cut post-harvest losses from 20–25% to roughly 10%, and create an additional 55 lakh direct and indirect lucrative job opportunities in the fisheries industry and related fields.
Read more about this report - REQUEST FREE SAMPLE COPY IN PDF
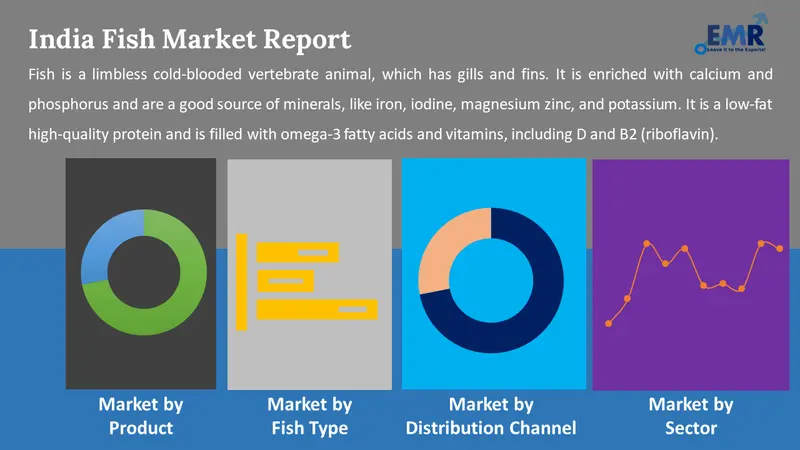
“India Fish Market Report and Forecast 2026-2035” offers a detailed analysis of the market based on the following segments:
Market Breakup by Product
Key Insight: The India fish market benefits from the rising consumption of freshwater fish by a significant population in the country. Freshwater fish forms an integral part of several Indian cuisines such as Fish Bhunna and Fish Chowder, among others. The rising network of fishermen and aquaculture farms across the country further increases its accessibility to consumers. As per the National Fisheries Development Board (NFDB), freshwater fish contribute around 65% of India's total fish production.
Market Breakup by Fish Type
Key Insight: According to India fish market analysis, inland fisheries lead the market, emerging as a major contributor to the overall fish production. Around 70% of India's fish production comes from inland waters. The remarkable growth of inland fisheries in India can be attributed to the growing adoption of modern practices and science-based fisheries. The producers are making efforts to enhance their yield and are focusing on responsible sourcing of seafood to meet the growing demand for high-quality products.
Market Breakup by Distribution Channel
Key Insight: Retail channels, including fish markets, supermarkets, and local vendors, remain the primary way consumers purchase fish, offering fresh and affordable options. Modern retail formats are gradually increasing their share, providing better hygiene and variety. Retail chains like Big Bazaar, D-Mart, and Reliance Fresh have expanded their seafood offerings to include packaged fish, frozen options, and value-added products. These retail stores are capitalizing on rising consumer demand for convenience and hygiene, providing a safer shopping environment compared to traditional markets.
Market Breakup by Sector
Key Insight: The organised sector in the India fish market has gained significant momentum, driven by the increasing demand for consistent quality, safety, and traceability. This segment includes large-scale seafood suppliers, modern retail chains, and brands that follow strict quality standards like GlobalG.A.P and HACCP.
Market Breakup by Region
Key Insight: South India is the leading region in India fish market, fueled by a coastal population with deep-rooted seafood preferences and advanced aquaculture practices. Kerala, Tamil Nadu, and Andhra Pradesh drive demand for marine fishes, shrimps, and scampi. The region benefits from established cold chain infrastructure and export-oriented seafood processing units, attracting investments and enhancing supply chain efficiency. Urbanisation and growing health awareness also boost consumption of fish as a protein source.
Frozen fish occupy a large India fish market share, due to the growth of cold chain logistics
As per the India fish market report, the frozen fish segment is also expected to witness sizeable growth in the coming years due to the growth of cold chain logistics in the country. The segment growth is further supported by the rising demand for convenient food products as well as innovations in freezing technology which enhances the quality and freshness of frozen fish. Additionally, the rising popularity of frozen fish fillets is further anticipated to support the demand for frozen fish products in the country.
Shrimps significantly contributes to the overall fish production in India
The demand for shrimps in the India fish market is also anticipated to increase significantly in the coming years and India is renowned as one of the largest exporters and producers of shrimps. Moreover, farmers in the states such as West Bengal are actively engaged in shrimp farming to meet the growing export demand. As per shrimp export data, frozen shrimp export from India totaled 83,763 shipments between November 2023 and October 2024. The largest shrimp exporter in the world is Ecuador, with an export value of 7.1 billion in 2024.
Scampi occupies a niche but growing segment in the India fish market, favoured for its taste and texture, with increasing demand in urban and export markets as supply chains improve. For instance, coastal states like Andhra Pradesh and Tamil Nadu have ramped up scampi farming, leveraging advanced hatchery techniques to boost production. Exporters are tapping into growing demand from Europe and Southeast Asia, where Indian scampi is appreciated for its competitive pricing and quality.
Expansion of HoReCa Segment in Urban India Driving Demand for High-Quality Seafood
Institutional and HoReCa (Hotels, Restaurants, Cafes) segments are expanding as eating out becomes more common in urban India, driving demand for quality seafood with reliable supply chains and consistent standards. The HoReCa segment, especially premium hotels and high-end restaurants, is focusing on offering a curated seafood menu, requiring a steady supply of fish that meets international standards of freshness and quality. For instance, restaurants and hotels in metro cities are increasingly sourcing seafood from certified suppliers who follow GlobalG.A.P (Good Agricultural Practices) and HACCP (Hazard Analysis and Critical Control Point) standards to ensure safety and quality.
Dominance of the Unorganised Sector in India Fish Market
The unorganised sector remains a dominant segment in India fish market, particularly in rural and peri-urban areas where local fishmongers and small-scale vendors cater to the bulk of the population. The unorganised sector benefits from the flexibility to meet immediate demand without the complexities of formal supply chains, often offering a wide variety of regional fish. As demand for fresh and regional varieties grows, the unorganised sector remains a key part of the market.
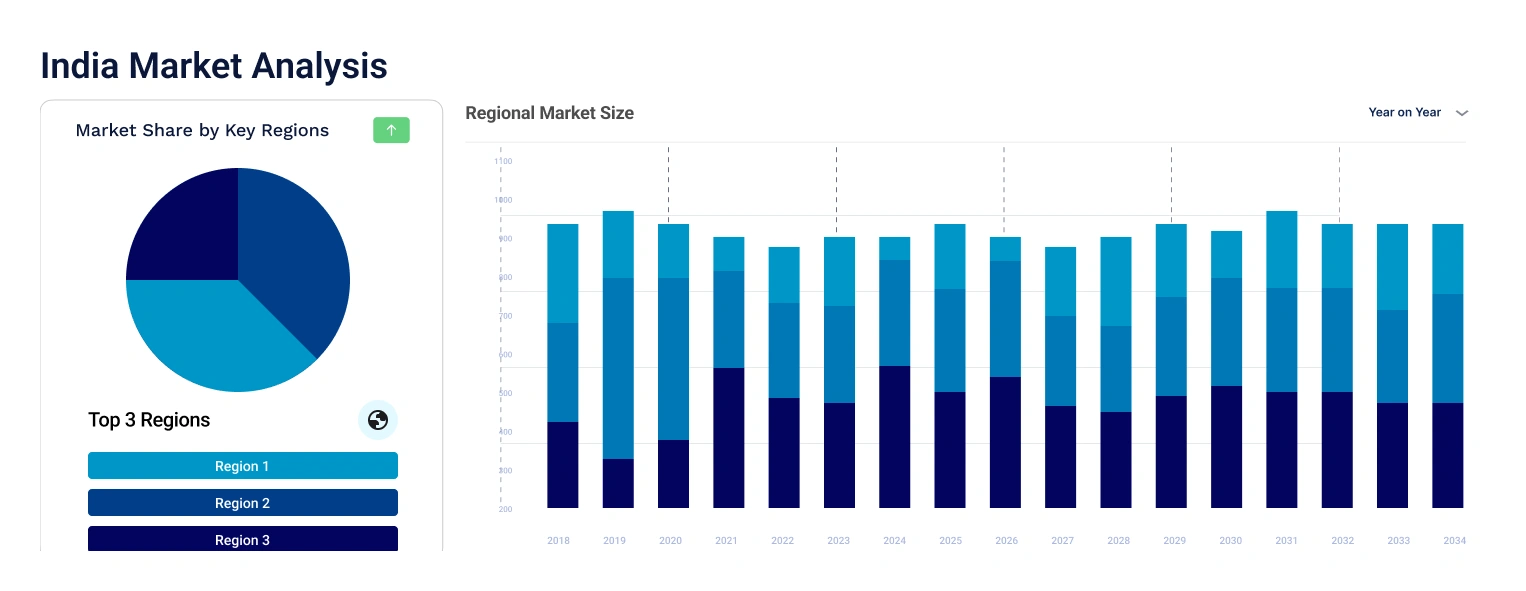
East and Central India occupy a large share due to increasing aquaculture activities
Emerging potential lies in East and Central India, where increasing aquaculture activities and improving logistics open new opportunities. The traditional preference for freshwater fish combined with expanding coastal fish availability is creating a demand for the India fish market. North India, though smaller in fish consumption, is gradually increasing demand due to rising urban middle-class populations exploring varied diets. The Aqua India Expo, held annually, has also played a pivotal role in showcasing the potential of the fish and aquaculture industry, helping to create a market for fish in areas where consumption was once minimal. West India, with its strong fishing communities and export capabilities, is expanding organised retail and cold storage facilities, indicating potential for further growth in marine fish and shrimp segments.
Read more about this report - REQUEST FREE SAMPLE COPY IN PDF
The India fish market is characterized by a diverse and competitive landscape, driven by the country's vast coastline, extensive inland water resources, and a growing consumer demand for fish and seafood products. Products made from fish and seafood are widely available in the market, including processed, frozen, fresh, and value-added goods. Shrimp, carp, catfish, and several marine fish are popular species. Companies compete by broadening the range of products they offer to meet the needs of various customer demographics and market segments. Competitive pricing is crucial, with companies striving to balance cost efficiency and profitability. Factors influencing pricing include production costs, market demand, and international trade dynamics. Seasonal variations and supply chain efficiency also impact pricing strategies, thus affecting the fish market share In India. Effective distribution networks are vital for market competition. Companies with robust logistics and supply chain management can ensure timely delivery and maintain product quality. Traditional wet markets, supermarkets, online platforms, and direct sales to restaurants and hotels are common distribution channels which are propelling the growth of the fish market.
Silver Sea Food is a leading seafood exporter in India, specializing in processing and exporting a wide range of marine products including fish, shrimp, and shellfish. The company emphasizes quality assurance, sustainable practices, and compliance with international standards to serve global markets, focusing on innovation and customer satisfaction.
Abad Fisheries Private Limited is a major player in India’s aquaculture and seafood export sector. It operates integrated shrimp farms, processing units, and distribution networks. The company is known for sustainable farming practices, advanced technology adoption, and catering to international markets with high-quality seafood products, including Vannamei shrimp and other marine varieties.
Seasaga Group is an established seafood processing and exporting company in India, offering a diverse product portfolio from shrimps to various fish species. The group focuses on stringent quality control, sustainable sourcing, and value-added products. Their operations include modern processing facilities that meet global food safety standards, catering primarily to the US, Europe, and Asian markets.
Geo Seafood is a prominent Indian seafood exporter with expertise in marine fish and shrimp processing. The company operates with a commitment to sustainable aquaculture and quality management, exporting products worldwide. Geo Seafood invests in technology-driven processes to maintain freshness and comply with international certifications, positioning itself as a reliable supplier in the competitive global seafood market.
*Please note that this is only a partial list; the complete list of key players is available in the full report. Additionally, the list of key players can be customized to better suit your needs.*
Other key players in the India fish market report are Apex Frozen Foods Ltd, Kirti Foods, Munnujii Foods International Pvt. Ltd, Oceans Secret, Prakash Foods, and Golden Prize India, among others.
Explore the latest trends in the India Fish Market 2026 with our in-depth report. Download a free sample today to uncover key retail channel dynamics and growth opportunities. Contact us for a personalized consultation to leverage expert insights and stay ahead in the evolving seafood market landscape.
United States Frozen Fish and Seafood Market
Australia Frozen Fish and Seafood Market
United States Ornamental Fish Market
Mexico Fish and Seafood Market
Fish Collagen Peptides Market
South Korea Tuna Fish Market
Fish and Seafood Market
India Basa Fish Market
Europe Fish Market
Mexico Fish Market
India Seafood Processing Industry Growth
India Aquaculture Inputs Market Growth


Upto 15% Off
USD
$2499 $2249
$3999 $3599
$4999 $4249
$5999 $5099


*While we strive to always give you current and accurate information, the numbers depicted on the website are indicative and may differ from the actual numbers in the main report. At Expert Market Research, we aim to bring you the latest insights and trends in the market. Using our analyses and forecasts, stakeholders can understand the market dynamics, navigate challenges, and capitalize on opportunities to make data-driven strategic decisions.*
Get in touch with us for a customized solution tailored to your unique requirements and save upto 35%!
In 2025, the India fish market attained a value of nearly INR 2073.79 Billion.
The market is projected to grow at a CAGR of 10.20% between 2026 and 2035.
The market is estimated to witness a healthy growth in the forecast period of 2026-2035 to reach about INR 5477.48 Billion by 2035.
The major drivers of the market are rising disposable incomes, increasing population, rise in the consumption of protein-rich foods, and growing domestic demand for fish-based food products.
The key trends guiding the growth of the market is the ease in the accessibility of processed fish products, including canned and frozen, due to the growth of the organised food retail sector and rising health awareness.
The major regions in the market are West Bengal, Andhra Pradesh, Karnataka, Kerala, Gujarat, Tamil Nadu, and Maharashtra, among others.
Inland fishes, marine fishes, shrimps, and scampi are the various fish types available in the market.
The major product types in the market are fresh, frozen, and canned, among others.
The significant distribution channels of fish are retail, institutional and HoReCa.
The organised and unorganised segments are the major sectors in the market.
The major players in the market are Silver Sea Food, Abad Fisheries Private Limited, Seasaga Group, Geo Seafood, Apex Frozen Foods Ltd, Kirti Foods, Munnujii Foods International Pvt. Ltd, Oceans Secret, Prakash Foods, and Golden Prize India, among others.
West Bengal is India’s one of the biggest fish market.
Explore our key highlights of the report and gain a concise overview of key findings, trends, and actionable insights that will empower your strategic decisions.
| REPORT FEATURES | DETAILS |
| Base Year | 2025 |
| Historical Period | 2019-2025 |
| Forecast Period | 2026-2035 |
| Scope of the Report |
Historical and Forecast Trends, Industry Drivers and Constraints, Historical and Forecast Market Analysis by Segment:
|
| Breakup by Product |
|
| Breakup by Fish Type |
|
| Breakup by Distribution Channel |
|
| Breakup by Sector |
|
| Breakup by Region |
|
| Market Dynamics |
|
| Trade Data Analysis |
|
| Competitive Landscape |
|
| Companies Covered |
|
Datasheet
One User
USD 2,499
USD 2,249
tax inclusive*
Single User License
One User
USD 3,999
USD 3,599
tax inclusive*
Five User License
Five User
USD 4,999
USD 4,249
tax inclusive*
Corporate License
Unlimited Users
USD 5,999
USD 5,099
tax inclusive*
*Please note that the prices mentioned below are starting prices for each bundle type. Kindly contact our team for further details.*
Flash Bundle
Small Business Bundle
Growth Bundle
Enterprise Bundle
*Please note that the prices mentioned below are starting prices for each bundle type. Kindly contact our team for further details.*
Flash Bundle
Number of Reports: 3
20%
tax inclusive*
Small Business Bundle
Number of Reports: 5
25%
tax inclusive*
Growth Bundle
Number of Reports: 8
30%
tax inclusive*
Enterprise Bundle
Number of Reports: 10
35%
tax inclusive*
How To Order

Select License Type
Choose the right license for your needs and access rights.

Click on ‘Buy Now’
Add the report to your cart with one click and proceed to register.

Select Mode of Payment
Choose a payment option for a secure checkout. You will be redirected accordingly.
Gain insights to stay ahead and seize opportunities.

Get insights & trends for a competitive edge.

Track prices with detailed trend reports.

Analyse trade data for supply chain insights.

Leverage cost reports for smart savings

Enhance supply chain with partnerships.

Connect For More Information
Our expert team of analysts will offer full support and resolve any queries regarding the report, before and after the purchase.
Our expert team of analysts will offer full support and resolve any queries regarding the report, before and after the purchase.
We employ meticulous research methods, blending advanced analytics and expert insights to deliver accurate, actionable industry intelligence, staying ahead of competitors.
Our skilled analysts offer unparalleled competitive advantage with detailed insights on current and emerging markets, ensuring your strategic edge.
We offer an in-depth yet simplified presentation of industry insights and analysis to meet your specific requirements effectively.


Share