

Consumer Insights
Uncover trends and behaviors shaping consumer choices today
Procurement Insights
Optimize your sourcing strategy with key market data
Industry Stats
Stay ahead with the latest trends and market analysis.
Trending Now


The global incident and emergency management market size reached around USD 126.38 Billion in 2024. The market is projected to grow at a CAGR of 6.30% between 2025 and 2034 to reach nearly USD 232.82 Billion by 2034.
Base Year
Historical Year
Forecast Year
In 2023, the U.S. recorded 28 major natural disasters including 17 severe weather events, 4 floods, 2 cyclones, 2 tornados, 1 cold storm, 1 wildfire, and 1 heatwave.
In 2022, the deaths from natural disasters accounted for 76,100 globally.
The incorporation of advanced technologies such as robotics, data analytics, AI, and cybersecurity management plays pivotal roles in damage assessment, search and rescue operations while also aiding in recording aerial video in real-time to expedite response time.


Value in USD Billion
2025-2034
Incident and Emergency Management Market Outlook
*this image is indicative*
Disaster management is a comprehensive process that involves IT solutions such as early warning systems, AI-based impact analysis, data management, and communication networks to mitigate the risk and casualties associated with it.
In 2010-2020 period, an average of 13,980 deaths were attributable to extreme temperatures while earthquakes and floods registered 13,465 and 5,274 deaths respectively.
The U.S. government launched several disaster management programmes such as the Maryland Emergency Management System (MEMS) and the Community Emergency Response Team (CERT), to protect citizens from natural disasters, terrorist attacks, and other emergencies through training. The EU humanitarian budget for the year 2024 is more than USD 1.93 billion (€1.8 billion), which is higher than their usual budget for disaster management.
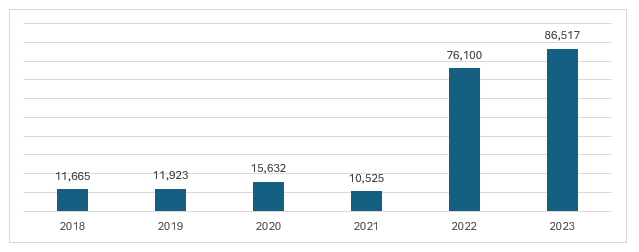
Natural disasters have a large impact on vulnerable populations in low- to middle-income nations lacking the necessary infrastructure for adequate protection and response. In 2023, 86,517 deaths were attributed to natural disasters, increasing from 76,100 in 2022.
Figure: Number of Deaths from Natural Disasters Globally, 2018-2024
Rising cases of natural disasters; technological advancements; increasing importance of improving responsiveness; and increasing importance of incident management in healthcare sector are the key trends impacting the incident and emergency management market growth.
Natural disasters such as earthquakes, floods, and hurricanes hinder economic growth by affecting tangible assets such as buildings, equipment, and human capital. In 2023, 86,517 deaths due to natural disasters were recorded globally.
Adoption and advancement in technologies help anticipate and respond that results in efficient and timely actions. Early warning systems, including satellites and hydrological models, remote sensing and geographical information systems (GIS) aid in predicting disasters in advance.
In order to provide better support during an emergency, the World Bank introduced the Crisis Toolkit and the IDA Crisis Response Window to respond to crises and strengthen preparedness for future shocks. Further, in 2024–2027, the EU aims to add an additional €2.5 billion to the disaster management reserve.
Hospitals, assisted living centers, and ambulatory care establishments are increasingly investing in incident management to ensure patient safety. These systems allow the facilities to produce incident reports when accidents or infections occur, understand their causes, and offer a better quality of care to patients. Additionally, it helps hospitals optimise their resource allocation by prioritising incidents based on severity and impact.


A rise in government funding supports the development and implementation of emergency management solutions. Finance ministries of countries globally have the power to increase their spending in emergency response mechanisms to overcome unforeseen demands. For instance, contingency appropriations within the approved budget or any revolving contingency fund can be used by the government to meet high-priority needs. Further, emergency spending provisions in some jurisdictions allow for spending excess budgeted amounts during emergencies.
The European Union’s EU Mission aims to build 100 climate-neutral and smart cities by 2030. Further, according to the United Nations, 70% of the world’s population is expected to reside in smart cities by 2050. The rapid expansion of smart cities has increased the cruciality of emergency evacuation and preparedness systems to enhance public services and safety aspects.
“Global Incident and Emergency Management Market Report and Forecast 2025-2034” offers a detailed analysis of the market based on the following segments:
Market Breakup by Component
Market Breakup by Solution
Market Breakup by End User
Market Breakup by Region
The geospatial solution enjoys significant demand in the incident and emergency management market
Geographic information system (GIS) integrates statistics and maps related to natural events and socioeconomic trends, which helps in storing, visualising, and better analysis of geographic data. Meanwhile, disaster recovery plans ensure businesses can keep operating after an interruption by outlining steps to restore critical functions quickly. This minimises downtime and gets things back to normal as soon as possible.
Disaster preparedness gets a boost with situational awareness solutions. These solutions offer real-time insights and early warnings, empowering first responders to react quickly and effectively.
Based on end use, the government sector is a major contributor to the incident and emergency management market revenue
There are various laws and government bodies responsible for incident and emergency management, such as the National Disaster Management Authority (NDMA) in India which works as the apex body for disaster management. Furthermore, in the United States, FEMA created the National Incident Management System (NIMS), which comprises the Incident Command System (ICS). All US governmental entities adopt NIMS as the norm for emergency management, for both planned and unplanned disasters.
Damage to cargo, loss of cargo, accidents involving hazardous materials or people, technical failure, strikes, as well as unforeseen events like political conflicts or sudden weather changes can impact the delivery of goods and supplies.
The market players are focusing on the quality of the service offered, building strong relationships with key stakeholders and offering innovative solutions.
Headquartered in Sweden, Hexagon is engaged in providing digital reality solutions, combining sensor, software and autonomous technologies. The company operates with a workforce of around 24,500 professionals spread across 50 countries.
IBM is a global leader in providing computer hardware and software, cloud computing and data analytics. Headquartered in the United States, the company provides various technologies which are used across a wide range of industries including aerospace and defence, automotive, healthcare, and oil and gas amongst others.
Motorola Solutions focuses on enhancing safety by developing and integrating technologies that protect individuals, property, and locations. Founded in 1928, Motorola Solutions operates across more than 100 countries with a workforce of 21,000 employees.
Honeywell is an integrated operating company that serves a diverse range of industries and geographies globally. Headquartered in the United States, the company has a workforce of over 97,000 employees spread across 79 countries, including 34,000 in the United States.
*Please note that this is only a partial list; the complete list of key players is available in the full report. Additionally, the list of key players can be customized to better suit your needs.*
Other notable players operating in the incident and emergency management market are Siemens AG, Datalink Internet Systems P/L, Alert Technologies Corporation, Environmental Systems Research Institute, Inc., R1 RCM Inc, and Everbridge Inc., among others.
Disasters in North America transcend national borders, necessitating coordinated responses among the United States and Canada. The countries have enacted legislative frameworks and bilateral agreements to manage emergencies, with specific provisions for cross-border coordination. In 2022-23, accident and emergency attendances in England reached 25.3 million, a 4.0% increase from the previous year and an 18.0% increase since 2011-12. England reported 28,014 attendances per 100,000 population with Northern Ireland having the highest rate at 34,729 per 100,000 in 2022-2023.
China's State Council issued a plan to strengthen its emergency management system during the 14th Five-Year Plan period (2021-2025). The plan aims to modernise emergency management capabilities and reduce losses from disasters and accidents, prioritising people’s and property’s safety.
Incident and Emergency Management Market Size
Incident and Emergency Management Market Growth
Incident and Emergency Management Market Trends
Incident and Emergency Management Market Share
*While we strive to always give you current and accurate information, the numbers depicted on the website are indicative and may differ from the actual numbers in the main report. At Expert Market Research, we aim to bring you the latest insights and trends in the market. Using our analyses and forecasts, stakeholders can understand the market dynamics, navigate challenges, and capitalize on opportunities to make data-driven strategic decisions.*
Get in touch with us for a customized solution tailored to your unique requirements and save upto 35%!
In 2024, the market reached an approximate value of USD 126.38 Billion.
The market is projected to grow at a CAGR of 6.30% between 2025 and 2034.
The market is estimated to witness healthy growth in the forecast period of 2025-2034 to reach a value of around USD 232.82 Billion by 2034.
The key components include system and service.
The key regional markets for incident and emergency management are North America, Europe, the Asia Pacific, Latin America, and the Middle East and Africa.
The end uses include government, BFSI, transportation and logistics, healthcare, manufacturing, IT and telecom, and others.
The solutions include geospatial solution, disaster recovery solution, and situational awareness solution.
The key players in the market include Hexagon AB, International Business Machines Corporation, Motorola Solutions, Inc., Honeywell International Inc., Siemens AG, Datalink Internet Systems P/L, Alert Technologies Corporation, Environmental Systems Research Institute, Inc., R1 RCM Inc, and Everbridge Inc, among others.
Explore our key highlights of the report and gain a concise overview of key findings, trends, and actionable insights that will empower your strategic decisions.
| REPORT FEATURES | DETAILS |
| Base Year | 2024 |
| Historical Period | 2018-2024 |
| Forecast Period | 2025-2034 |
| Scope of the Report |
Historical and Forecast Trends, Industry Drivers and Constraints, Historical and Forecast Market Analysis by Segment:
|
| Breakup by Component |
|
| Breakup by Solution |
|
| Breakup by End User |
|
| Breakup by Region |
|
| Market Dynamics |
|
| Competitive Landscape |
|
| Companies Covered |
|
Datasheet
One User
USD 2,499
USD 2,249
tax inclusive*
Single User License
One User
USD 3,999
USD 3,599
tax inclusive*
Five User License
Five User
USD 4,999
USD 4,249
tax inclusive*
Corporate License
Unlimited Users
USD 5,999
USD 5,099
tax inclusive*
*Please note that the prices mentioned below are starting prices for each bundle type. Kindly contact our team for further details.*
Flash Bundle
Small Business Bundle
Growth Bundle
Enterprise Bundle
*Please note that the prices mentioned below are starting prices for each bundle type. Kindly contact our team for further details.*
Flash Bundle
Number of Reports: 3
20%
tax inclusive*
Small Business Bundle
Number of Reports: 5
25%
tax inclusive*
Growth Bundle
Number of Reports: 8
30%
tax inclusive*
Enterprise Bundle
Number of Reports: 10
35%
tax inclusive*
How To Order
Our step-by-step guide will help you select, purchase, and access your reports swiftly, ensuring you get the information that drives your decisions, right when you need it.

Select License Type
Choose the right license for your needs and access rights.

Click on ‘Buy Now’
Add the report to your cart with one click and proceed to register.

Select Mode of Payment
Choose a payment option for a secure checkout. You will be redirected accordingly.
Track prices with detailed trend reports.

Analyse trade data for supply chain insights.

Leverage cost reports for smart savings

Enhance supply chain with partnerships.

Gain insights to stay ahead and seize opportunities.

Get insights & trends for a competitive edge.

Track prices with detailed trend reports.
Analyse trade data for supply chain insights.
Leverage cost reports for smart savings
Enhance supply chain with partnerships.
Gain insights to stay ahead and seize opportunities.
Get insights & trends for a competitive edge.
Track prices with detailed trend reports.
Analyse trade data for supply chain insights.
Connect For More Information
Our expert team of analysts will offer full support and resolve any queries regarding the report, before and after the purchase.
Our expert team of analysts will offer full support and resolve any queries regarding the report, before and after the purchase.
We employ meticulous research methods, blending advanced analytics and expert insights to deliver accurate, actionable industry intelligence, staying ahead of competitors.
Our skilled analysts offer unparalleled competitive advantage with detailed insights on current and emerging markets, ensuring your strategic edge.
We offer an in-depth yet simplified presentation of industry insights and analysis to meet your specific requirements effectively.
Australia
63 Fiona Drive, Tamworth, NSW
+61-448-061-727
India
C130 Sector 2 Noida, Uttar Pradesh 201301
+91-723-689-1189
Philippines
40th Floor, PBCom Tower, 6795 Ayala Avenue Cor V.A Rufino St. Makati City,1226.
+63-287-899-028, +63-967-048-3306
United Kingdom
6 Gardner Place, Becketts Close, Feltham TW14 0BX, Greater London
+44-753-713-2163
United States
30 North Gould Street, Sheridan, WY 82801
+1-415-325-5166
Vietnam
193/26/4 St.no.6, Ward Binh Hung Hoa, Binh Tan District, Ho Chi Minh City
+84-865-399-124
United States (Head Office)
30 North Gould Street, Sheridan, WY 82801
+1-415-325-5166
Australia
63 Fiona Drive, Tamworth, NSW
+61-448-061-727
India
C130 Sector 2 Noida, Uttar Pradesh 201301
+91-723-689-1189
Philippines
40th Floor, PBCom Tower, 6795 Ayala Avenue Cor V.A Rufino St. Makati City, 1226.
+63-287-899-028, +63-967-048-3306
United Kingdom
6 Gardner Place, Becketts Close, Feltham TW14 0BX, Greater London
+44-753-713-2163
Vietnam
193/26/4 St.no.6, Ward Binh Hung Hoa, Binh Tan District, Ho Chi Minh City
+84-865-399-124


Share