Sale

Hydrostatic Transmission Market

Global Hydrostatic Transmission Market Size, Share, Trends: By Capacity Type: Light Duty, Medium Duty, Heavy Duty; By Operation: VDM-CDP, VDP-CDM, VDM-VDP; By End Use: Transportation, Construction, Mining, Agriculture, Others; Regional Analysis; Market Dynamics: SWOT Analysis, Porter’s Five Forces Analysis; Competitive Landscape; 2024-2032

Global Hydrostatic Transmission Market Outlook

The global hydrostatic transmission market is expected to grow at a CAGR of 4.80% in the forecast period of 2024-2032.


Hydrostatic Transmission Market

Read more about this report - REQUEST FREE SAMPLE COPY IN PDF


The Asia Pacific to Hold a Significant Market Share in the Hydrostatic Transmission Industry

The Asia Pacific is projected to hold a significant share in the global market for hydrostatic transmission, with substantial growth in the region over the forecast period owing to the booming construction and mining industries in the region. Countries like China and India in the Asia Pacific regions have invested considerably in the construction of new and improved roads and infrastructure, requiring advanced heavy machinery and equipment. This has significantly boosted the growth of the market for hydrostatic transmission. Other regions like North America, Latin America, and Europe are also expected to witness significant growth in the coming years.


Hydrostatic Transmission Market Segmentation

Hydrostatic transmission is a fluid driven transmission system used in low-speed conditions for producing high torque. The hydrostatic transmission mechanism transforms mechanical energy by incompressible fluid in pressure energy, which at the output shaft is also transformed into mechanical energy. In general, the hydrostatic transmission system is used in vehicles for industrial purposes, such as ground-moving equipment, forklifts, and loaders.


Hydrostatic Transmission Market by End Use

Read more about this report - REQUEST FREE SAMPLE COPY IN PDF


The capacity type of hydrostatic transmission can be divided as follows:

  • Light Duty  
  • Medium Duty 
  • Heavy Duty

By operation, the market can be categorised as follows:

  • VDM-CDP 
  • VDP-CDM 
  • VDM-VDP

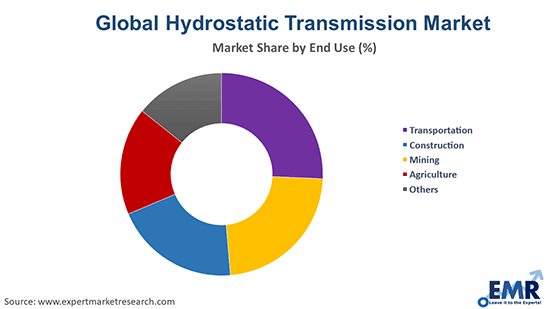
Hydrostatic transmission finds its end-uses in the following sectors:

The regional markets for hydrostatic transmission can be divided into North America, Europe, the Asia Pacific, Latin America, and the Middle East and Africa.


Hydrostatic Transmission Market by Region

Read more about this report - REQUEST FREE SAMPLE COPY IN PDF


Rising Demand from the End-Use Industries to Bolster the Market Growth of Hydrostatic Transmission

The rapid growth of various industries like construction, transportation, and agricultural sectors is among the primary factors driving the market growth. The product finds extensive applications in power generation systems, such as wind turbine generators, engine generators, railway vehicles, and ships, among others. The mining sector is also projected to expand at a significant rate of growth during the forecast period to meet the demand for metals and mineral products, which is an important requirement for the manufacturing industry. Moreover, the economic growth of the regions is leading to the increased investments in the defence sector, which uses hydrostatic transmission, further driving the global market. These factors are expected to propel the growth of the hydrostatic transmission industry in the coming years.


Key Industry Players in the Global Hydrostatic Transmission Market

The report gives a detailed analysis of the following key players in the global hydrostatic transmission market, covering their competitive landscape, capacity, and latest developments like mergers, acquisitions, and investments, expansions of capacity, and plant turnarounds:

  • Parker Hannifin Corp 
  • Dana Incorporated 
  • Eaton Corporation plc 
  • Komatsu America Corp. 
  • Kawasaki Heavy Industries, Ltd. 
  • Tuff Torq Corporation 
  • Others

The comprehensive EMR report provides an in-depth assessment of the market based on the Porter's five forces model along with giving a SWOT analysis.


Key Highlights of the Report

REPORT FEATURES DETAILS
Base Year 2023
Historical Period 2018-2023
Forecast Period 2024-2032
Scope of the Report

Historical and Forecast Trends, Industry Drivers and Constraints, Historical and Forecast Market Analysis by Segment:

  • Capacity Type
  • Operation
  • End Use
  • Region
Breakup by Capacity Type
  • Light Duty
  • Medium Duty
  • Heavy Duty
Breakup by Operation
  • VDM-CDP
  • VDP-CDM
  • VDM-VDP
Breakup by End Use 
  • Transportation
  • Construction
  • Mining
  • Agriculture
  • Others
Breakup by Region
  • North America
    • United States of America 
    • Canada
  • Europe
    • United Kingdom
    • Germany
    • France
    • Italy
    • Others
  • Asia Pacific
    • China
    • Japan
    • India
    • ASEAN
    • Australia
    • Others
  • Latin America
    • Brazil
    • Argentina
    • Mexico
    • Others
  • Middle East and Africa
    • Saudi Arabia
    • United Arab Emirates
    • Nigeria
    • South Africa
    • Others
Market Dynamics
  • SWOT Analysis
  • Porter's Five Forces Analysis
  • Key Indicators for Demand
  • Key Indicators for Price
Competitive Landscape
  • Market Structure
  • Company Profiles
    • Company Overview
    • Product Portfolio
    • Demographic Reach and Achievements
    • Certifications
Companies Covered
  • Parker Hannifin Corp
  • Dana Incorporated
  • Eaton Corporation plc
  • Komatsu America Corp.
  • Kawasaki Heavy Industries, Ltd.
  • Tuff Torq Corporation
  • Others
Report Price and Purchase Option Explore our purchase options that are best suited to your resources and industry needs.
Delivery Format Delivered as an attached PDF and Excel through email, with an option of receiving an editable PPT, according to the purchase option.


*At Expert Market Research, we strive to always give you current and accurate information. The numbers depicted in the description are indicative and may differ from the actual numbers in the final EMR report.

1    Preface
2    Report Coverage – Key Segmentation and Scope
3    Report Description

    3.1    Market Definition and Outlook
    3.2    Properties and Applications
    3.3    Market Analysis
    3.4    Key Players
4    Key Assumptions
5    Executive Summary

    5.1    Overview
    5.2    Key Drivers
    5.3    Key Developments
    5.4    Competitive Structure
    5.5    Key Industrial Trends
6    Snapshot
    6.1    Global
    6.2    Regional
7    Opportunities and Challenges in the Market
8    Global Hydrostatic Transmission Market Analysis

    8.1    Key Industry Highlights
    8.2    Global Hydrostatic Transmission Historical Market (2018-2023) 
    8.3    Global Hydrostatic Transmission Market Forecast (2024-2032)
    8.4    Global Hydrostatic Transmission Market by Capacity Type
        8.4.1    Light Duty 
            8.4.1.1    Historical Trend (2018-2023)
            8.4.1.2    Forecast Trend (2024-2032)
        8.4.2    Medium Duty
            8.4.2.1    Historical Trend (2018-2023)
            8.4.2.2    Forecast Trend (2024-2032)
        8.4.3    Heavy Duty
            8.4.3.1    Historical Trend (2018-2023)
            8.4.3.2    Forecast Trend (2024-2032)
    8.5    Global Hydrostatic Transmission Market by Operation
        8.5.1    VDM-CDP
            8.5.1.1    Historical Trend (2018-2023)
            8.5.1.2    Forecast Trend (2024-2032)
        8.5.2    VDP-CDM
            8.5.2.1    Historical Trend (2018-2023)
            8.5.2.2    Forecast Trend (2024-2032)
        8.5.3    VDM-VDP
            8.5.3.1    Historical Trend (2018-2023)
            8.5.3.2    Forecast Trend (2024-2032)
    8.6    Global Hydrostatic Transmission Market by End Use 
        8.6.1    Transportation
            8.6.1.1    Historical Trend (2018-2023)
            8.6.1.2    Forecast Trend (2024-2032)
        8.6.2    Construction
            8.6.2.1    Historical Trend (2018-2023)
            8.6.2.2    Forecast Trend (2024-2032)
        8.6.3    Mining
            8.6.3.1    Historical Trend (2018-2023)
            8.6.3.2    Forecast Trend (2024-2032)
        8.6.4    Agriculture
            8.6.4.1    Historical Trend (2018-2023)
            8.6.4.2    Forecast Trend (2024-2032)
        8.6.5    Others 
    8.7    Global Hydrostatic Transmission Market by Region
        8.7.1    North America
            8.7.1.1    Historical Trend (2018-2023)
            8.7.1.2    Forecast Trend (2024-2032)
        8.7.2    Europe
            8.7.2.1    Historical Trend (2018-2023)
            8.7.2.2    Forecast Trend (2024-2032)
        8.7.3    Asia Pacific
            8.7.3.1    Historical Trend (2018-2023)
            8.7.3.2    Forecast Trend (2024-2032)
        8.7.4    Latin America
            8.7.4.1    Historical Trend (2018-2023)
            8.7.4.2    Forecast Trend (2024-2032)
        8.7.5    Middle East and Africa
            8.7.5.1    Historical Trend (2018-2023)
            8.7.5.2    Forecast Trend (2024-2032)
9    North America Hydrostatic Transmission Market Analysis
    9.1    United States of America
        9.1.1    Historical Trend (2018-2023)
        9.1.2    Forecast Trend (2024-2032)
    9.2    Canada
        9.2.1    Historical Trend (2018-2023)
        9.2.2    Forecast Trend (2024-2032)
10    Europe Hydrostatic Transmission Market Analysis
    10.1    United Kingdom
        10.1.1    Historical Trend (2018-2023)
        10.1.2    Forecast Trend (2024-2032)
    10.2    Germany
        10.2.1    Historical Trend (2018-2023)
        10.2.2    Forecast Trend (2024-2032)
    10.3    France
        10.3.1    Historical Trend (2018-2023)
        10.3.2    Forecast Trend (2024-2032)
    10.4    Italy
        10.4.1    Historical Trend (2018-2023)
        10.4.2    Forecast Trend (2024-2032)
    10.5    Others
11    Asia Pacific Hydrostatic Transmission Market Analysis
    11.1    China
        11.1.1    Historical Trend (2018-2023)
        11.1.2    Forecast Trend (2024-2032)
    11.2    Japan
        11.2.1    Historical Trend (2018-2023)
        11.2.2    Forecast Trend (2024-2032)
    11.3    India
        11.3.1    Historical Trend (2018-2023)
        11.3.2    Forecast Trend (2024-2032)
    11.4    ASEAN
        11.4.1    Historical Trend (2018-2023)
        11.4.2    Forecast Trend (2024-2032)
    11.5    Australia
        11.5.1    Historical Trend (2018-2023)
        11.5.2    Forecast Trend (2024-2032)
    11.6    Others
12    Latin America Hydrostatic Transmission Market Analysis
    12.1    Brazil
        12.1.1    Historical Trend (2018-2023)
        12.1.2    Forecast Trend (2024-2032)
    12.2    Argentina
        12.2.1    Historical Trend (2018-2023)
        12.2.2    Forecast Trend (2024-2032)
    12.3    Mexico
        12.3.1    Historical Trend (2018-2023)
        12.3.2    Forecast Trend (2024-2032)
    12.4    Others
13    Middle East and Africa Hydrostatic Transmission Market Analysis
    13.1    Saudi Arabia
        13.1.1    Historical Trend (2018-2023)
        13.1.2    Forecast Trend (2024-2032)
    13.2    United Arab Emirates
        13.2.1    Historical Trend (2018-2023)
        13.2.2    Forecast Trend (2024-2032)
    13.3    Nigeria
        13.3.1    Historical Trend (2018-2023)
        13.3.2    Forecast Trend (2024-2032)
    13.4    South Africa
        13.4.1    Historical Trend (2018-2023)
        13.4.2    Forecast Trend (2024-2032)
    13.5    Others
14    Market Dynamics
    14.1    SWOT Analysis
        14.1.1    Strengths
        14.1.2    Weaknesses
        14.1.3    Opportunities
        14.1.4    Threats
    14.2    Porter’s Five Forces Analysis
        14.2.1    Supplier’s Power
        14.2.2    Buyer’s Power
        14.2.3    Threat of New Entrants
        14.2.4    Degree of Rivalry
        14.2.5    Threat of Substitutes
    14.3    Key Indicators for Demand
    14.4    Key Indicators for Price
15    Value Chain Analysis
16    Competitive Landscape

    16.1    Market Structure
    16.2    Company Profiles
        16.2.1    Parker Hannifin Corp
            16.2.1.1    Company Overview
            16.2.1.2    Product Portfolio
            16.2.1.3    Demographic Reach and Achievements
            16.2.1.4    Certifications
        16.2.2    Dana Incorporated
            16.2.2.1    Company Overview
            16.2.2.2    Product Portfolio
            16.2.2.3    Demographic Reach and Achievements
            16.2.2.4    Certifications
        16.2.3    Eaton Corporation plc
            16.2.3.1    Company Overview
            16.2.3.2    Product Portfolio
            16.2.3.3    Demographic Reach and Achievements
            16.2.3.4    Certifications
        16.2.4    Komatsu America Corp.
            16.2.4.1    Company Overview
            16.2.4.2    Product Portfolio
            16.2.4.3    Demographic Reach and Achievements
            16.2.4.4    Certifications
        16.2.5    Kawasaki Heavy Industries, Ltd.
            16.2.5.1    Company Overview
            16.2.5.2    Product Portfolio
            16.2.5.3    Demographic Reach and Achievements
            16.2.5.4    Certifications
        16.2.6    Tuff Torq Corporation
            16.2.6.1    Company Overview
            16.2.6.2    Product Portfolio
            16.2.6.3    Demographic Reach and Achievements
            16.2.6.4    Certifications
        16.2.7    Others
17    Key Trends and Developments in the Market


List of Key Figures and Tables

1.    Global Hydrostatic Transmission Market: Key Industry Highlights, 2018 and 2032
2.    Global Hydrostatic Transmission Historical Market: Breakup by Capacity Type (USD Billion), 2018-2023
3.    Global Hydrostatic Transmission Market Forecast: Breakup by Capacity Type (USD Billion), 2024-2032
4.    Global Hydrostatic Transmission Historical Market: Breakup by Operation (USD Billion), 2018-2023
5.    Global Hydrostatic Transmission Market Forecast: Breakup by Operation (USD Billion), 2024-2032
6.    Global Hydrostatic Transmission Historical Market: Breakup by End Use (USD Billion), 2018-2023
7.    Global Hydrostatic Transmission Market Forecast: Breakup by End Use (USD Billion), 2024-2032
8.    Global Hydrostatic Transmission Historical Market: Breakup by Region (USD Billion), 2018-2023
9.    Global Hydrostatic Transmission Market Forecast: Breakup by Region (USD Billion), 2024-2032
10.    North America Hydrostatic Transmission Historical Market: Breakup by Country (USD Billion), 2018-2023
11.    North America Hydrostatic Transmission Market Forecast: Breakup by Country (USD Billion), 2024-2032
12.    Europe Hydrostatic Transmission Historical Market: Breakup by Country (USD Billion), 2018-2023
13.    Europe Hydrostatic Transmission Market Forecast: Breakup by Country (USD Billion), 2024-2032
14.    Asia Pacific Hydrostatic Transmission Historical Market: Breakup by Country (USD Billion), 2018-2023
15.    Asia Pacific Hydrostatic Transmission Market Forecast: Breakup by Country (USD Billion), 2024-2032
16.    Latin America Hydrostatic Transmission Historical Market: Breakup by Country (USD Billion), 2018-2023
17.    Latin America Hydrostatic Transmission Market Forecast: Breakup by Country (USD Billion), 2024-2032
18.    Middle East and Africa Hydrostatic Transmission Historical Market: Breakup by Country (USD Billion), 2018-2023
19.    Middle East and Africa Hydrostatic Transmission Market Forecast: Breakup by Country (USD Billion), 2024-2032
20.    Global Hydrostatic Transmission Market Structure

Key Questions Answered in the Report

The global hydrostatic transmission market is projected to grow at a CAGR of 4.80% between 2024 and 2032.

The major market drivers include growing construction and mining activities, rapid urbanisation, and rapid industrialisation.

The key trends guiding the market growth include increasing investments in the defence sector, healthy economic growth of developing countries, and the rising use of hydrostatic transmission in power generation systems.

The major regions in the market are North America, Latin America, the Middle East and Africa, Europe, and the Asia Pacific.

The leading capacity types of hydrostatic transmission in the market are light duty, medium duty, and heavy duty.

The major operations of hydrostatic transmission in the market are VDM-CDP, VDP-CDM, and VDM-VDP.

The significant end uses of hydrostatic transmission are transportation, construction, mining, and agriculture, among others.

The major players in the market are Parker Hannifin Corp, Dana Incorporated, Eaton Corporation plc, Komatsu America Corp., Kawasaki Heavy Industries, Ltd., and Tuff Torq Corporation, among others.

Analyst Review

The global hydrostatic transmission market is being driven by the growing demand from the construction. Aided by the growing demand from the defence sector, the market is expected to witness a healthy growth in the forecast period of 2024-2032, growing at a CAGR of 4.80%.

EMR’s meticulous research methodology delves deep into the market, covering the macro and micro aspects of the industry. Based on capacity type, the market is divided into light duty, medium duty, and heavy duty. On the basis of operation, the industry is segmented into VDM-CDP, VDP-CDM, and VDM-VDP. By end use, the market is categorised into transportation, construction, mining, and agriculture, among others. The major regional markets for hydrostatic transmission are North America, Europe, the Asia Pacific, Latin America, and the Middle East and Africa. The key players in the above market include Parker Hannifin Corp, Dana Incorporated, Eaton Corporation plc, Komatsu America Corp., Kawasaki Heavy Industries, Ltd., and Tuff Torq Corporation, among others.

EMR’s research methodology uses a combination of cutting-edge analytical tools and the expertise of their highly accomplished team, thus, providing their customers with market insights that are accurate, actionable, and help them remain ahead of their competition.

Purchase Full Report

Mini Report

$ 2199     $1999
  • Selected Sections, One User
  • Printing Not Allowed
  • Email Delivery in PDF
  • Free Limited Customisation
  • Post Sales Analyst Support
  • 50% Discount on Next Update

Single User License

$ 3299     $2999
  • All Sections, One User
  • One Print Allowed
  • Email Delivery in PDF
  • Free Limited Customisation
  • Post Sales Analyst Support
  • 50% Discount on Next Update
most popular

Five User License

$ 4399     $3999
  • All Sections, Five Users
  • Five Prints Allowed
  • Email Delivery in PDF
  • Free Limited Customisation
  • Post Sales Analyst Support
  • 50% Discount on Next Update

Corporate License

$ 5499     $4999
  • All Sections, Unlimited Users
  • Unlimited Prints Allowed
  • Email Delivery in PDF + Excel
  • Free Limited Customisation
  • Post Sales Analyst Support
  • 50% Discount on Next Update

Any Question? Speak With An Analyst

Contact Analyst

View A Sample

Request Sample

Did You Miss Anything, Ask Now

Request Customisation
Why Expert Market Research?

Right People

We are technically excellent, strategic, practical, experienced and efficient; our analysts are hand-picked based on having the right attributes to work successfully and execute projects based on your expectations.

Right Methodology

We leverage our cutting-edge technology, our access to trusted databases, and our knowledge of the current models used in the market to deliver you research solutions that are tailored to your needs and put you ahead of the curve.

Right Price

We deliver in-depth and superior quality research in prices that are reasonable, unmatchable, and shows our understanding of your resource structure. We, additionally, offer attractive discounts on our upcoming reports.

Right Support

Our team of expert analysts are at your beck and call to deliver you optimum results that are customised to meet your precise needs within the specified timeframe and help you form a better understanding of the industry.

NEWSLETTER