

Consumer Insights
Uncover trends and behaviors shaping consumer choices today
Procurement Insights
Optimize your sourcing strategy with key market data
Industry Stats
Stay ahead with the latest trends and market analysis.

The global hydrographic survey equipment market attained a value of about USD 3.65 Billion in 2025. The market is further expected to grow in the forecast period of 2026-2035 at a CAGR of 6.80% to reach nearly USD 7.05 Billion by 2035.
Base Year
Historical Period
Forecast Period
Compound Annual Growth Rate
6.8%
Value in USD Billion
2026-2035
*this image is indicative*
| Global Hydrographic Survey Equipment Market Report Summary | Description | Value |
| Base Year | USD Billion | 2025 |
| Historical Period | USD Billion | 2019-2025 |
| Forecast Period | USD Billion | 2026-2035 |
| Market Size 2025 | USD Billion | 3.65 |
| Market Size 2035 | USD Billion | 7.05 |
| CAGR 2019-2025 | Percentage | XX% |
| CAGR 2026-2035 | Percentage | 6.80% |
| CAGR 2026-2035 - Market by Region | Asia Pacific | 7.6% |
| CAGR 2026-2035 - Market by Country | India | 7.7% |
| CAGR 2026-2035 - Market by Country | China | 7.3% |
| CAGR 2026-2035 - Market by Depth | Shallow Water | 7.8% |
| CAGR 2026-2035 - Market by Platform | Surface Vessels | 7.4% |
| Market Share by Country 2025 | Brazil | 3.2% |
The increasing use of hydrographic survey equipment in ports and harbours is propelling the market growth. As water level changes are crucial to determine the crest elevation of water, hydrographic survey equipment is deployed in the construction of ports and harbours, thereby augmenting the market growth.
Read more about this report - REQUEST FREE SAMPLE COPY IN PDF
Moreover, the requirement for precise accuracy in the construction of ports and harbours is surging the utilisation of hydrographic survey equipment, which is driving the growth of the industry.
With the growing use of bathymetric data in the maintenance and operations of ports and harbours, the market for hydrographic survey equipment is witnessing robust growth. In addition, such data is further utilised to ensure the safety of vessels, which is significantly contributing to the growth of the hydrographic survey equipment industry. As vessels are increasingly becoming larger and heavier, hydrographic surveys are essential to ensure their compliance with regulatory standards. This, in turn, is further fuelling the market for hydrographic survey equipment.
Read more about this report - REQUEST FREE SAMPLE COPY IN PDF
Hydrographic survey equipment refers to instruments that are deployed to navigate the physical features of water bodies and land areas near them. It is used to map out water depth and aids in the identification of shapes of the seafloor as well as the location of potential obstructions in water bodies. Hydrographic survey equipment also enhances the safety and efficiency of maritime transportation.
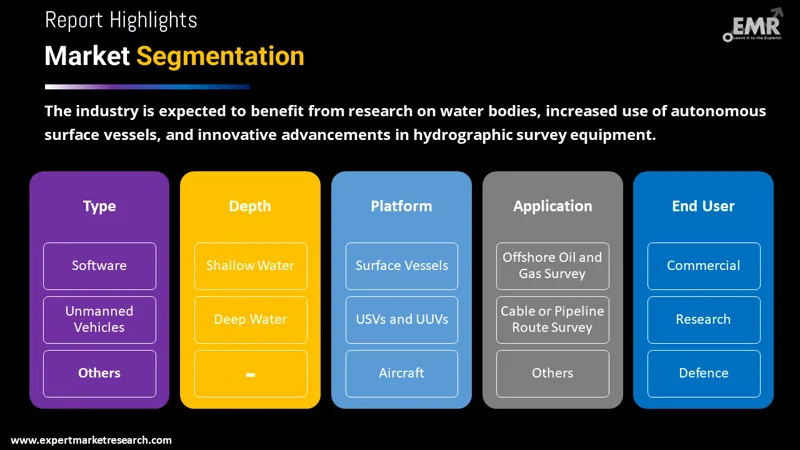
Market Breakup by Type
Market Breakup by Depth
Market Breakup by Platform
Market Breakup by Application
Market Breakup by End User
Market Breakup by Region
| CAGR 2026-2035 - Market by | Country |
| India | 7.7% |
| China | 7.3% |
| Mexico | 7.2% |
| Saudi Arabia | 7.0% |
| UK | 6.7% |
| USA | 6.4% |
| Canada | XX% |
| France | XX% |
| Italy | XX% |
| Japan | XX% |
| Australia | XX% |
| Brazil | XX% |
| Germany | 6.0% |


As the attempts to surge the understanding of water bodies is increasing, the demand for hydrographic survey equipment is increasing, thereby invigorating the industry growth. The growing utilisation of autonomous surface vessels to analyse and gain high-resolution topical data in currents and tides, among others, is driving the market growth of hydrographic survey equipment. Moreover, the rising use of hydrographic survey equipment that provides faster and more accurate hydrographic results is augmenting the growth of the market.
With rapid technological advancements, new technologies are increasingly integrated to efficiently process and analyse large volumes of data derived from hydrographic survey equipment. The development of hydrographic survey equipment that can be efficiently deployed in challenging environments is expected to propel the market growth. Moreover, leading companies are increasingly deploying innovative methods to equip vessels with hydrographic survey equipment for accessing unreachable areas, which is estimated to augment the growth of the industry in the forecast period.
The report presents a detailed analysis of the following key players in the global hydrographic survey equipment market, looking into their capacity, market shares, and latest developments like capacity expansions, plant turnarounds, and mergers and acquisitions:
The comprehensive report looks into the macro and micro aspects of the industry. The EMR report gives an in-depth insight into the market by providing a SWOT analysis as well as an analysis of Porter’s Five Forces model.


Upto 15% Off
USD
$2499 $2249
$3999 $3599
$4999 $4249
$5999 $5099


*While we strive to always give you current and accurate information, the numbers depicted on the website are indicative and may differ from the actual numbers in the main report. At Expert Market Research, we aim to bring you the latest insights and trends in the market. Using our analyses and forecasts, stakeholders can understand the market dynamics, navigate challenges, and capitalize on opportunities to make data-driven strategic decisions.*
Get in touch with us for a customized solution tailored to your unique requirements and save upto 35%!
In 2025, the global hydrographic survey equipment market attained a value of nearly USD 3.65 Billion.
The market is projected to grow at a CAGR of 6.80% between 2026 and 2035.
The market is estimated to witness a healthy growth in the forecast period of 2026-2035 to reach about USD 7.05 Billion by 2035.
The market is being aided by the growing demand for hydrographic survey equipment in port and harbour management, the increasing utilisation of bathymetric data, and the surging volume and size of vessels.
The industry is predicted to be bolstered by the increasing research activities on water bodies, the growing utilisation of autonomous surface vessels, and the development of innovative hydrographic survey equipment.
The major regions in the industry are North America, Latin America, the Middle East and Africa, Europe, and the Asia Pacific.
The major types of hydrographic survey equipment in the industry are sensing systems, positioning systems, subsea sensors, software, and unmanned vehicles, among others.
The various depths of hydrographic survey equipment are shallow water and deep water.
The different platforms of hydrogenic survey equipment are surface vessels, USVs and UUVs, and aircraft.
The major application segments of hydrographic survey equipment are hydrographic or bathymetry survey, port and harbour management, offshore oil and gas survey, and cable or pipeline route survey, among others.
The significant end users in the market are commercial, research, and defence.
The major players in the industry are EdgeTech, Valeport Ltd, CEE HydroSystems , SyQwest Incorporated, and Teledyne Technologies Incorporated, among others.
Explore our key highlights of the report and gain a concise overview of key findings, trends, and actionable insights that will empower your strategic decisions.
| REPORT FEATURES | DETAILS |
| Base Year | 2025 |
| Historical Period | 2019-2025 |
| Forecast Period | 2026-2035 |
| Scope of the Report |
Historical and Forecast Trends, Industry Drivers and Constraints, Historical and Forecast Market Analysis by Segment:
|
| Breakup by Type |
|
| Breakup by Depth |
|
| Breakup by Platform |
|
| Breakup by Application |
|
| Breakup by End User |
|
| Breakup by Region |
|
| Market Dynamics |
|
| Competitive Landscape |
|
| Companies Covered |
|
| Report Price and Purchase Option | Explore our purchase options that are best suited to your resources and industry needs. |
| Delivery Format | Delivered as an attached PDF and Excel through email, with an option of receiving an editable PPT, according to the purchase option. |
Datasheet
One User
USD 2,499
USD 2,249
tax inclusive*
Single User License
One User
USD 3,999
USD 3,599
tax inclusive*
Five User License
Five User
USD 4,999
USD 4,249
tax inclusive*
Corporate License
Unlimited Users
USD 5,999
USD 5,099
tax inclusive*
*Please note that the prices mentioned below are starting prices for each bundle type. Kindly contact our team for further details.*
Flash Bundle
Small Business Bundle
Growth Bundle
Enterprise Bundle
*Please note that the prices mentioned below are starting prices for each bundle type. Kindly contact our team for further details.*
Flash Bundle
Number of Reports: 3
20%
tax inclusive*
Small Business Bundle
Number of Reports: 5
25%
tax inclusive*
Growth Bundle
Number of Reports: 8
30%
tax inclusive*
Enterprise Bundle
Number of Reports: 10
35%
tax inclusive*
How To Order

Select License Type
Choose the right license for your needs and access rights.

Click on ‘Buy Now’
Add the report to your cart with one click and proceed to register.

Select Mode of Payment
Choose a payment option for a secure checkout. You will be redirected accordingly.
Gain insights to stay ahead and seize opportunities.

Get insights & trends for a competitive edge.

Track prices with detailed trend reports.

Analyse trade data for supply chain insights.

Leverage cost reports for smart savings

Enhance supply chain with partnerships.

Connect For More Information
Our expert team of analysts will offer full support and resolve any queries regarding the report, before and after the purchase.
Our expert team of analysts will offer full support and resolve any queries regarding the report, before and after the purchase.
We employ meticulous research methods, blending advanced analytics and expert insights to deliver accurate, actionable industry intelligence, staying ahead of competitors.
Our skilled analysts offer unparalleled competitive advantage with detailed insights on current and emerging markets, ensuring your strategic edge.
We offer an in-depth yet simplified presentation of industry insights and analysis to meet your specific requirements effectively.


Share