

Consumer Insights
Uncover trends and behaviors shaping consumer choices today
Procurement Insights
Optimize your sourcing strategy with key market data
Industry Stats
Stay ahead with the latest trends and market analysis.

The global hydrocolloids market reached a value of almost USD 11.97 Billion in 2025. The hydrocolloids industry is further expected to grow at a CAGR of 6.50% between 2026 and 2035 to reach a value of nearly USD 22.47 Billion by 2035.
Base Year
Historical Period
Forecast Period
With the growing vegan population, there is a rising demand for hydrocolloids such as pectin, agar-agar, and carrageenan to provide thickening, gelling, and stabilising properties without using animal-based ingredients. As per the National Center for Biotechnology Information (NCBI), there were nearly 88 million vegan individuals worldwide in 2023.
Technological advancements in extraction and processing aimed at improving the efficiency and cost-effectiveness of hydrocolloid production with improved performance characteristics, including higher viscosity, solubility, and enhanced stability, are aiding the market. Moreover, advancements in extraction techniques to develop more sustainable hydrocolloids, such as those derived from renewable plant and seaweed sources, are expected to drive the market in upcoming years.
Manufacturers in the hydrocolloids market are increasingly customising hydrocolloids to meet the specific needs of diverse applications in sectors such as food, packaging, cosmetics, and pharmaceuticals, among others, while reducing waste and improving the overall cost-effectiveness of production. In the forecast period, the growing interest in sustainable packaging is expected to surge the use of customisable hydrocolloids to create biodegradable, edible, and water-soluble films.
Compound Annual Growth Rate
6.5%
Value in USD Billion
2026-2035
*this image is indicative*
| Global Hydrocolloids Market Report Summary | Description | Value |
| Base Year | USD Billion | 2025 |
| Historical Period | USD Billion | 2019-2025 |
| Forecast Period | USD Billion | 2026-2035 |
| Market Size 2025 | USD Billion | 11.97 |
| Market Size 2035 | USD Billion | 22.47 |
| CAGR 2019-2025 | Percentage | XX% |
| CAGR 2026-2035 | Percentage | 6.50% |
| CAGR 2026-2035 - Market by Region | Asia Pacific | 7.5% |
| CAGR 2026-2035 - Market by Country | India | 8.6% |
| CAGR 2026-2035 - Market by Country | China | 7.2% |
| CAGR 2026-2035 - Market by Product | Xanthan Gum | 7.4% |
| CAGR 2026-2035 - Market by Product | Carrageenan | 7.0% |
| Market Share by Country 2025 | Germany | 4.5% |
The global hydrocolloids market is supported by North America, which is a leading consumer for hydrocolloids. The hydrocolloids market is driven by the oil well drilling and strong pharma spending in this region. Areas such as the Asia Pacific and the United States are the major producers as well as consumers of hydrocolloids. In Europe, Germany and France are the largest consumers in the hydrocolloids market, aided by the pharmaceutical and food industries in the region.
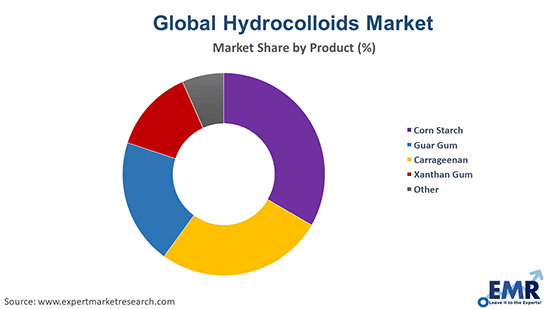
Corn starch accounts for the largest industry share in the global hydrocolloids market, followed by guar gum, xanthan gum, and carrageenan. India accounts for the largest share of the guar seed production and is the largest exporter of guar gum in the world. The country accounts for 80-85% of the global guar seed and gum production, followed by Pakistan. The future for guar is viewed to be optimistic, due to the large and continuous demand for guar, especially from North America, owing to the shale revolution and the investigation of new oil reserves in China. Asia and Europe are the major producers for xanthan gum, contributing about 80% of the product. The demand for xanthan gum is projected to increase owing to rising oil and gas production in China, along with the increasing demand for the product in the chemical and automobile industries. The demand for xanthan gum is expected to intensify due to the growth of the food and beverage industry in China, Malaysia, India, and Singapore in the forecast period.
Carrageenan has also witnessed increased production in recent years, with the Asia Pacific contributing to a significant portion of the production share. The industry is especially large in the Asia Pacific as compared to North America and Europe due to an increase in the demand from the fast and processed food sector, accelerating the industry in the Asia Pacific region. The Philippines is the largest producer of carrageenan, accounting for 77% of the world's supply of the hydrocolloid. In the Asia Pacific, China is the key exporter of carrageenan to the United States and Europe. The product is usually used in the confectionery industry in the United States for the suspension of chocolates.
Growing uses of hydrocolloids in the food industry; rising demand for natural beauty products; robust growth of the pharmaceuticals sector; and increasing focus on sustainability are favouring the hydrocolloids market expansion.
The food industry utilises hydrocolloids as thickening, gelling, stabilising, and emulsifying agents to enhance the sensory experiences of food products, extend their shelf stability, and enable the development of functional and speciality foods. Moreover, hydrocolloids, due to their ability to control the release of active ingredients and digestive health benefits, are widely used in health and functional foods.
The growing demand for natural beauty products is boosting the hydrocolloids market revenue. Hydrocolloids derived from renewable and natural sources like seaweed, bacteria, and plants are increasingly used in natural and clean beauty products due to their thickening, hydrating, stabilising, and emulsifying properties.
Due to their excellent biological properties, biocompatibility, and low toxicity, hydrocolloids are widely used in the fabrication of nanocarriers for controlled and targeted drug delivery. In addition, hydrocolloids, by modifying the release rate of drugs, improve the bioavailability of poorly soluble drugs, making them indispensable in pharmaceutical applications.
Hydrocolloids are derived from natural polymers extracted from plant exudates, seaweed, and microbial fermentation, the cultivation of which can lead to loss of biodiversity and habitat destruction, among other environmental issues. With the growing trend of sustainability, key players are sustainably sourcing hydrocolloids and seeking certifications for sustainable and ethical sourcing.
Read more about this report - REQUEST FREE SAMPLE COPY IN PDF
Hydrocolloid is defined as a colloid system that forms a gel when it comes in contact with water. It can be both reversible and irreversible (single state). For example, agar is a reversible hydrocolloid of seaweed extract and can exist in gel and solid-state, and change states through the use or avoidance of heat.
Market Breakup by Product
Market Breakup by Region


| CAGR 2026-2035 - Market by | Country |
| India | 8.6% |
| China | 7.2% |
| Canada | 6.2% |
| France | 5.1% |
| Italy | 4.6% |
| USA | XX% |
| UK | XX% |
| Germany | XX% |
| Japan | 4.5% |
| Australia | XX% |
| Saudi Arabia | XX% |
| Brazil | XX% |
| Mexico | XX% |
The global hydrocolloids market is driven by the rising oil well drilling and strong pharma spending. The corn starch is the leading segment of the hydrocolloids market, aided by the huge demand from the food sector and the oil and gas industry. Xanthan gum and carrageenan are also witnessing a rising demand from the food and beverage sector due to the growing health consciousness among the consumers and the diverse functionality of hydrocolloids.
There is a considerable demand for guar gum due to its favourable properties, such as natural thickness and biodegradability, which is aiding the growth of the overall hydrocolloids market. The production of guar gum is expected to increase in the forecast period due to the expected rise in the guar production during the summer season. The guar gum industry is highly influenced by the oil and gas industry, owing to the usage of guar gum in the form of drilling aids to maintain viscosity and mitigate friction during oil well fracturing and stimulation process. Thus, the guar gum industry is growing at a steady pace due to the growth of the oil and gas industry.
Key hydrocolloids market players are offering eco-friendly and responsibly sourced hydrocolloids while emphasising transparency and traceability in their supply chain. Hydrocolloids companies are also developing non-GMO and natural hydrocolloid products to meet the clean-label requirements of customers.
Ingredion Incorporated, founded in 1906 and headquartered in Illinois, United States, is a leading global ingredients solution provider that serves customers in more than 120 countries across the world. The company turns fruits, grains, vegetables, and other plant-based materials into value-added ingredients for use in the animal nutrition, food, beverage, and industrial sectors.
Kerry Group plc, headquartered in Kerry, Ireland, and founded in 1972, is a prominent food and beverage company. It has also established its position as a leader in the pharmaceutical sector. The company boasts over 22,000 employees and more than 150 manufacturing and innovation centres across 30 countries.
Daicel Corporation, headquartered in Osaka, Japan, and established in 1919, is a prominent chemical company. It is also a pioneer of acetic acid manufacturing in Japan and boasts an extensive product portfolio, ranging from general-purpose resins to engineering plastics. With an employee base of over 11,000, the company achieved annual sales of JPY 558.1 billion in FY 2023-24.
Lotus Gums & Chemicals, founded in 1981 and headquartered in Rajasthan, India, is a prominent supplier of high-quality guar gum at competitive prices. The company’s modern and sophisticated plant, featuring advanced equipment, boasts a manufacturing capacity of 1000-1200 MT of guar gum powder per month.
*Please note that this is only a partial list; the complete list of key players is available in the full report. Additionally, the list of key players can be customized to better suit your needs.*
Other key players in the hydrocolloids market are Cargill, Incorporated, and Archer Daniels Midland Company, among others.


Upto 15% Off
USD
$3999 $3599
$2499 $2249
$4999 $4249
$5999 $5099


*While we strive to always give you current and accurate information, the numbers depicted on the website are indicative and may differ from the actual numbers in the main report. At Expert Market Research, we aim to bring you the latest insights and trends in the market. Using our analyses and forecasts, stakeholders can understand the market dynamics, navigate challenges, and capitalize on opportunities to make data-driven strategic decisions.*
Get in touch with us for a customized solution tailored to your unique requirements and save upto 35%!
In 2025, the market attained a value of approximately USD 11.97 Billion.
The market is projected to grow at a CAGR of 6.50% between 2026 and 2035.
The market is estimated to witness a healthy growth in the forecast period of 2026-2035 to reach about USD 22.47 Billion by 2035.
The major drivers of the market are increasing oil well drilling, strong pharma spending, and growing demand from the oil and gas industry.
The key trends guiding the growth of the market include the rising production of guar gum and increasing demand for hydrocolloids in the chemical and automotive sectors.
The major regions in the market are North America, Latin America, the Middle East and Africa, Europe, and the Asia Pacific, with North America accounting for the largest share in the market.
The major products of hydrocolloids in the market are corn starch, guar gum, carrageenan, and xanthan gum, with corn starch leading the market.
The major players in the global hydrocolloids market are Cargill, Incorporated, Archer Daniels Midland Company, Ingredion Incorporated, Kerry Group plc, Lotus Gums & Chemicals, and Daicel Corporation, among others.
Explore our key highlights of the report and gain a concise overview of key findings, trends, and actionable insights that will empower your strategic decisions.
| REPORT FEATURES | DETAILS |
| Base Year | 2025 |
| Historical Period | 2019-2025 |
| Forecast Period | 2026-2035 |
| Scope of the Report |
Historical and Forecast Trends, Industry Drivers and Constraints, Historical and Forecast Market Analysis by Segment:
|
| Breakup by Product |
|
| Breakup by Region |
|
| Market Dynamics |
|
| Competitive Landscape |
|
| Companies Covered |
|
| Report Price and Purchase Option | Explore our purchase options that are best suited to your resources and industry needs. |
| Delivery Format | Delivered as an attached PDF and Excel through email, with an option of receiving an editable PPT, according to the purchase option. |
Single User License
One User
USD 3,999
USD 3,599
tax inclusive*
Datasheet
One User
USD 2,499
USD 2,249
tax inclusive*
Five User License
Five User
USD 4,999
USD 4,249
tax inclusive*
Corporate License
Unlimited Users
USD 5,999
USD 5,099
tax inclusive*
*Please note that the prices mentioned below are starting prices for each bundle type. Kindly contact our team for further details.*
Flash Bundle
Small Business Bundle
Growth Bundle
Enterprise Bundle
*Please note that the prices mentioned below are starting prices for each bundle type. Kindly contact our team for further details.*
Flash Bundle
Number of Reports: 3
20%
tax inclusive*
Small Business Bundle
Number of Reports: 5
25%
tax inclusive*
Growth Bundle
Number of Reports: 8
30%
tax inclusive*
Enterprise Bundle
Number of Reports: 10
35%
tax inclusive*
How To Order

Select License Type
Choose the right license for your needs and access rights.

Click on ‘Buy Now’
Add the report to your cart with one click and proceed to register.

Select Mode of Payment
Choose a payment option for a secure checkout. You will be redirected accordingly.
Gain insights to stay ahead and seize opportunities.

Get insights & trends for a competitive edge.

Track prices with detailed trend reports.

Analyse trade data for supply chain insights.

Leverage cost reports for smart savings

Enhance supply chain with partnerships.

Connect For More Information
Our expert team of analysts will offer full support and resolve any queries regarding the report, before and after the purchase.
Our expert team of analysts will offer full support and resolve any queries regarding the report, before and after the purchase.
We employ meticulous research methods, blending advanced analytics and expert insights to deliver accurate, actionable industry intelligence, staying ahead of competitors.
Our skilled analysts offer unparalleled competitive advantage with detailed insights on current and emerging markets, ensuring your strategic edge.
We offer an in-depth yet simplified presentation of industry insights and analysis to meet your specific requirements effectively.


Share