

Consumer Insights
Uncover trends and behaviors shaping consumer choices today
Procurement Insights
Optimize your sourcing strategy with key market data
Industry Stats
Stay ahead with the latest trends and market analysis.

The global hydration containers market size reached around USD 15.98 Billion in 2025. The market is projected to grow at a CAGR of 7.60% between 2026 and 2035 to reach nearly USD 33.24 Billion by 2035. The market growth can be attributed to the robust growth of the e-commerce sector, the rising utilisation of 3D printing technology, the growing trend of health and wellness, the growing emphasis on sustainability, and the development of smart hydration containers.
Base Year
Historical Period
Forecast Period
With the robust growth of the e-commerce sector, consumers are purchasing hydration containers online due to the convenience and the availability of a wider selection of products. In Q4 2024, US retail e-commerce sales reached USD 308.9 billion, a surge of 2.7% from Q3 2024. The increase in e-commerce sales is prompting hydration container brands to invest in e-commerce and digital marketing strategies and expand their direct-to-consumer sales channels to cater to evolving customer demands.
Consumers are increasingly seeking multi-functional hydration containers with built-in storage compartments for snacks or supplements or with fruit infusers, integrated straws, and self-cleaning mechanisms. Moreover, the introduction of self-cleaning mechanisms using technologies like electrolytic self-cleaning or UV-C light in multi-functional hydration containers is boosting their appeal among consumers who value convenience, hygiene, and ease of maintenance.
The rising popularity of outdoor activities like cycling, hiking, camping, and adventure sports is creating hydration containers market opportunities. In 2024, outdoor participation in the United States increased by 4.1% to reach 175.8 million participants. As an increasing number of consumers are participating in outdoor activities, the demand for products such as hydration packs, compact, portable water bottles, and water bottles with insulated designs is increasing.
Compound Annual Growth Rate
7.6%
Value in USD Billion
2026-2035
*this image is indicative*
As per the hydration containers market analysis, there is a growing utilisation of 3D printing technology to create customised hydration containers based on individual preferences and choose unique sizes, shapes, and colours for their bottles. 3D printing also enables the creation of intricate designs, enabling brands to offer functional and innovative hydration containers with features such as built-in compartments, ergonomic handles, and integrated filtration systems.
High-end hydration containers, made from materials such as gold-plating and titanium, are gaining popularity as they offer enhanced durability and aesthetic appeal. Such containers are designed with superior insulation capabilities, making them appealing to customers valuing long-lasting temperature control. Moreover, premium hydration containers, presented in attractive packaging, are also gaining popularity as gifts.
Corporations and businesses are using promotional water bottles as unique and effective ways to increase brand visibility and provide long-term marketing benefits at a relatively low cost. Such water bottles also support health and wellness campaigns, encouraging regular hydration.
Read more about this report - REQUEST FREE SAMPLE COPY IN PDF
Rising trend of health and wellness; increasing demand for customised hydration containers; growing emphasis on sustainability; and the development of smart water bottles are favouring the hydration containers market expansion.
The rising focus on health and wellness and the growing awareness regarding the importance of hydration for cognitive health are prompting customers to seek products such as water bottles, tumblers, and shakers, among others, that can help them meet their hydration needs.
Key players are increasingly offering customisation options for hydration containers to include personalised colours, engravings, unique designs, and monograms that reflect consumers' personal preferences. Customisable hydration containers are also gaining prominence as personalised gifts for occasions such as corporate giveaways, holidays, and birthdays, among others.
With the growing emphasis on sustainability, the demand for hydration containers made of glass, stainless steel, and BPA-free plastics is increasing as they boast reusability, enhanced durability, and are more eco-friendly than single-use plastic bottles. Moreover, bioplastics derived from renewable resources such as cornstarch, sugarcane, and bamboo are gaining traction for use in hydration containers.
The development of smart water bottles that feature advanced technologies such as sensors to monitor water consumption in real-time and enable users to efficiently track their daily hydration levels is revolutionising the hydration containers market landscape. Smart water bottles also feature a temperature control system, a temperature display screen, LED lights, a water purifier, and a drinking reminder alarm that can track water intake.
With the growing trend of health and wellness, consumers are increasingly seeking hydration containers made from non-toxic and sustainable materials like BPA-free plastics and stainless steel. Customers are also preferring eco-friendly hydration containers to reduce waste and align with their environmentally responsible behaviours. In addition, there is a rising preference for hydration containers with built-in filters amid the increasing emphasis on healthy living.
Key players in the hydration containers market are adopting eco-friendly packaging solutions using materials like plant-based plastics, paper, and recycled cardboards to reduce the reliance on single-use plastics and contribute to sustainability. Various brands are also promoting refill stations to encourage the reuse of containers and promote a circular economy.
Read more about this report - REQUEST FREE SAMPLE COPY IN PDF
The EMR’s report titled “Global Hydration Containers Market Report and Forecast 2026-2035” offers a detailed analysis of the market based on the following segments:
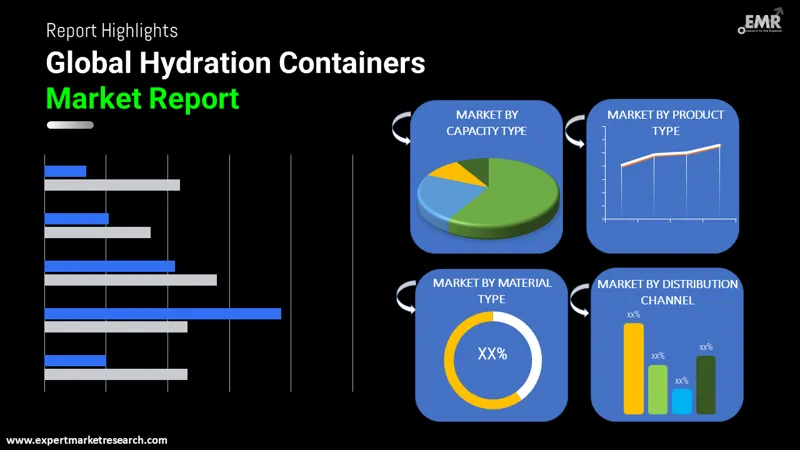
Market Breakup by Product Type
Market Breakup by Capacity
Market Breakup by Material Type
Market Breakup by Distribution Channel
Market Breakup by Region


Based on region, the market is segmented into North America, Europe, the Asia Pacific, Latin America, and the Middle East and Africa. The market in North America is growing amid the rising participation in sports and the increasing health consciousness. The surging use of hydration containers in outdoor sports, including camping and hiking, is further boosting the demand for reusable and durable bottles. Meanwhile, the market in Europe is being aided by the growing trend of sustainability and the rising focus on health and wellness.
Conversely, the Asia Pacific hydration containers market growth can be attributed to rapid urbanisation and the surging demand for recycled PET and stainless steel bottles in the region.
Key hydration containers market players are focusing on the use of sustainable materials like BPA-free plastics and stainless steel to align with .evolving customer expectations. They are also attempting to add multifunctional features like built-in storage for snacks, vitamins, or tea bags to their hydration containers amid the rising health-consciousness.
Cool Gear International, LLC., founded in 2000 and headquartered in Massachusetts, United States, is a leader in the hydration and houseware industries. It is engaged in designing and delivering customised products, packaging, and point of purchase displays for retailers and the premium market. The company is renowned for its unique designs, vibrant colours, graphics, and functionalities.
CAMELBAK PRODUCTS, LLC., headquartered in California, United States, and founded in 1989, is a prominent manufacturer of hydration packs, water bottles, and reservoirs. The company offers a lifetime guarantee on manufacturing defects in craftsmanship and materials.
Tupperware Brands Corporation, founded in 1946 and headquartered in Florida, United States, is a prominent consumer products company. The company has established its position as a leading manufacturer, designer, and distributor of high-quality and authentic products.
Vista Outdoor Inc., headquartered in Minnesota, United States, and founded in 2014, is a company involved in the designing, manufacturing, and marketing of outdoor recreation products. Some of its prominent brands include Foresight Sports, Simms Fishing Products, Camp Chef, Remington Ammunition, and QuietKat, among others. The company’s diverse portfolio offers customers high-quality, performance-driven, and innovative products.
*Please note that this is only a partial list; the complete list of key players is available in the full report. Additionally, the list of key players can be customized to better suit your needs.*
Other key players in the hydration containers market include Brita GMBH, Klean Kanteen, Inc., Thermo Fisher Scientific Inc., Nalge Nunc International Corp, and S’well, among others.


Upto 15% Off
USD
$3999 $3599
$2499 $2249
$4999 $4249
$5999 $5099


*While we strive to always give you current and accurate information, the numbers depicted on the website are indicative and may differ from the actual numbers in the main report. At Expert Market Research, we aim to bring you the latest insights and trends in the market. Using our analyses and forecasts, stakeholders can understand the market dynamics, navigate challenges, and capitalize on opportunities to make data-driven strategic decisions.*
Get in touch with us for a customized solution tailored to your unique requirements and save upto 35%!
In 2025, the global hydration containers market attained a value of nearly USD 15.98 Billion.
The market is estimated to grow at a CAGR of 7.60% between 2026 and 2035.
The major regions in the market are North America, Latin America, the Middle East and Africa, Europe, and the Asia Pacific.
The major drivers of the market include the increasing sporting activities, increase in the occurrence of government guidelines on the limitation of the plastic-based products, and rising demand for lightweight and eco-friendly containers.
The impact on the environment and changing preferences against the use of plastic bottles are the key trends guiding the growth of the market.
Water bottles, cans, mason jars, mugs, tumblers, shakers, and infusers are the major types of products included in the market.
Up to 20 oz., 21-40 oz., 41-60 oz., and above 60 oz. are the various capacity types.
Metal, polymer, glass, and silicone are the significant material types based on which the market has been segmented.
Direct sales, retailers, and e-retail are the different distribution channels of the market. Retailers are further segmented into hypermarket, supermarket, convenience stores, specialty stores, and discount stores.
The major players in the market are Cool Gear International, LLC., CAMELBAK PRODUCTS, LLC., Brita GMBH, Vista Outdoor Inc., Klean Kanteen, Inc., Tupperware Brands Corporation, Thermo Fisher Scientific Inc., Nalge Nunc International Corp, S’well, Others.
The market is estimated to witness healthy growth in the forecast period of 2026-2035 to reach a value of around USD 33.24 Billion by 2035.
Explore our key highlights of the report and gain a concise overview of key findings, trends, and actionable insights that will empower your strategic decisions.
| REPORT FEATURES | DETAILS |
| Base Year | 2025 |
| Historical Period | 2019-2025 |
| Forecast Period | 2026-2035 |
| Scope of the Report |
Historical and Forecast Trends, Industry Drivers and Constraints, Historical and Forecast Market Analysis by Segment:
|
| Breakup by Product Type |
|
| Breakup by Capacity Type |
|
| Breakup by Material Type |
|
| Breakup by Distribution Channel |
|
| Breakup by Region |
|
| Market Dynamics |
|
| Competitive Landscape |
|
| Companies Covered |
|
| Report Price and Purchase Option | Explore our purchase options that are best suited to your resources and industry needs. |
| Delivery Format | Delivered as an attached PDF and Excel through email, with an option of receiving an editable PPT, according to the purchase option. |
Single User License
One User
USD 3,999
USD 3,599
tax inclusive*
Datasheet
One User
USD 2,499
USD 2,249
tax inclusive*
Five User License
Five User
USD 4,999
USD 4,249
tax inclusive*
Corporate License
Unlimited Users
USD 5,999
USD 5,099
tax inclusive*
*Please note that the prices mentioned below are starting prices for each bundle type. Kindly contact our team for further details.*
Flash Bundle
Small Business Bundle
Growth Bundle
Enterprise Bundle
*Please note that the prices mentioned below are starting prices for each bundle type. Kindly contact our team for further details.*
Flash Bundle
Number of Reports: 3
20%
tax inclusive*
Small Business Bundle
Number of Reports: 5
25%
tax inclusive*
Growth Bundle
Number of Reports: 8
30%
tax inclusive*
Enterprise Bundle
Number of Reports: 10
35%
tax inclusive*
How To Order

Select License Type
Choose the right license for your needs and access rights.

Click on ‘Buy Now’
Add the report to your cart with one click and proceed to register.

Select Mode of Payment
Choose a payment option for a secure checkout. You will be redirected accordingly.
Gain insights to stay ahead and seize opportunities.

Get insights & trends for a competitive edge.

Track prices with detailed trend reports.

Analyse trade data for supply chain insights.

Leverage cost reports for smart savings

Enhance supply chain with partnerships.

Connect For More Information
Our expert team of analysts will offer full support and resolve any queries regarding the report, before and after the purchase.
Our expert team of analysts will offer full support and resolve any queries regarding the report, before and after the purchase.
We employ meticulous research methods, blending advanced analytics and expert insights to deliver accurate, actionable industry intelligence, staying ahead of competitors.
Our skilled analysts offer unparalleled competitive advantage with detailed insights on current and emerging markets, ensuring your strategic edge.
We offer an in-depth yet simplified presentation of industry insights and analysis to meet your specific requirements effectively.


Share