

Consumer Insights
Uncover trends and behaviors shaping consumer choices today
Procurement Insights
Optimize your sourcing strategy with key market data
Industry Stats
Stay ahead with the latest trends and market analysis.

The global haptic technology market value is expected to grow at a CAGR of 14.00% during the forecast period of 2026-2035.
Base Year
Historical Period
Forecast Period
Compound Annual Growth Rate
14%
2026-2035
*this image is indicative*
| Global Haptic Technology Market Report Summary | Description | Value |
| Base Year | USD Billion | 2025 |
| Historical Period | USD Billion | 2019-2025 |
| Forecast Period | USD Billion | 2026-2035 |
| Market Size 2025 | USD Billion | XX |
| Market Size 2035 | USD Billion | XX |
| CAGR 2019-2025 | Percentage | XX% |
| CAGR 2026-2035 | Percentage | 14.00% |
| CAGR 2026-2035 - Market by Region | North America | 15.3% |
| CAGR 2026-2035 - Market by Country | USA | 15.4% |
| CAGR 2026-2035 - Market by Country | UK | 15.2% |
| CAGR 2026-2035 - Market by Component | Software | 15.8% |
| CAGR 2026-2035 - Market by Feedback | Tactile | 14.7% |
| Market Share by Country 2025 | Italy | 2.6% |
Haptic technology simulates the sense of touch through vibrations or other sensations, serving as an interface between the user and the device. It delivers tactile or force feedback, enhancing user experience, thus, driving the demand of the haptic technology market. Haptics find wide applications and are known to enhance the user experience by engaging sound, light, and touch, especially in joysticks, controllers, and steering wheels in video games.
With growing digitisation and increasing penetration and usage of internet-enabled devices, the demand for haptic technologies is expected to grow in the coming years, especially in the Asia Pacific region. Additionally, technological advancements are expected to drive the haptic technology market forward. Early adoption of technology and rapid advancements in the field have provided impetus to the haptic technology industry growth.
Furthermore, research and development activities across the globe and the drive to develop newer applications for haptic technology are expected to drive the industry forward. Changing lifestyles coupled with an increasing demand for touchscreens for enhanced consumer experience are expected to bolster the growth of the haptic technology market.
According to the Industry report of 2020, consumer electronics ownership trends showed steady and increasing patterns globally. Smartphone ownership remained constant at 89% from 2019 to 2020. Smart TV ownership saw a notable rise from 51% in 2019 to 56% in 2020, while smart home devices (excluding smart speakers) increased from 18% to 22%. The smartwatch market also expanded, with ownership growing from 15% in 2019 to 20% in 2020. Smart speaker penetration went up from 26% in 2019 to 31% in 2020, and tablet ownership rose from 51% to 55%.
Desktop computer ownership saw a modest increase from 43% in 2019 to 44% in 2020, while laptop ownership rose notably from 62% to 66%. By 2020, 25% of consumers had tried VR technology, with 75% of them having a positive experience. This growing interest in VR, coupled with the benefits of haptic technology, which adds tactile feedback to enhance immersion, is driving the haptic technology market revenue.
According to MSIM estimates from June 2020, video game spending in 2019 totalled USD 194 billion, with mobile gaming contributing USD 85 billion, console gaming USD 54 billion, and PC gaming USD 55 billion globally. By 2020, total spending rose to USD 205 billion, with mobile gaming at USD 94 billion, console gaming at USD 55 billion, and PC gaming steady at USD 56 billion. The upward trend continued in 2021, reaching USD 214 billion in total spending. Mobile gaming further increased to USD 108 billion, console gaming stayed at USD 56 billion, and PC gaming grew to USD 58 billion. In 2022, total spending climbed to USD 224 billion, with mobile gaming at USD 114 billion, console gaming at USD 58 billion, and PC gaming at USD 60 billion.
As per industry reports, total gaming expenditure stood at USD 237 billion in 2023, with mobile gaming accounting for USD 119 billion, console gaming at USD 57 billion, and PC gaming at USD 61 billion. By 2024, total spending is expected to rise to USD 242 billion, with mobile gaming increasing to USD 125 billion, console gaming remaining at USD 57 billion, and PC gaming growing to USD 62 billion. In 2025, total spending is forecast to reach USD 246 billion, with mobile gaming continuing to lead at USD 125 billion, console gaming slightly increasing to USD 58 billion, and PC gaming rising to USD 63 billion. This growth in gaming expenditure supports the haptic technology industry revenue as it enhances gaming experiences through tactile feedback that replicates real-world sensations.


Read more about this report - REQUEST FREE SAMPLE COPY IN PDF
The EMR’s report titled “Haptic Technology Market Report and Forecast 2026-2035" offers a detailed analysis of the market based on the following segments:
Market Breakup by Technology
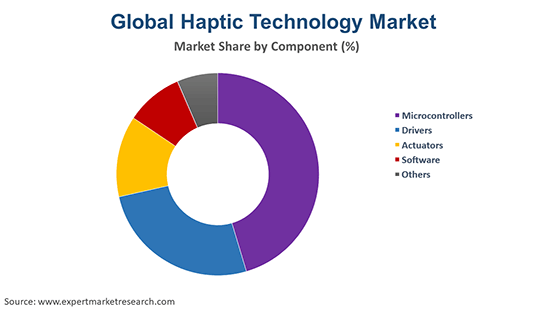
Market Breakup by Component
Market Breakup by Feedback
Market Breakup by Application
Market Breakup by Region
| CAGR 2026-2035 - Market by | Country |
| USA | 15.4% |
| UK | 15.2% |
| China | 14.7% |
| Germany | 14.1% |
| Brazil | 13.2% |
| Canada | XX% |
| France | XX% |
| Italy | XX% |
| Japan | XX% |
| India | XX% |
| Australia | XX% |
| Saudi Arabia | 12.8% |
| Mexico | XX% |
Rapidly growing demands for consumer electronics devices, like smartphones, tablets, and home appliances, and the need for product differentiation are driving the global haptic technology market forward. As new industries are joining the market, there has been a rise in new technologies and improvements in the existing structures of haptic technologies, taking the market forward. Moreover, increasing demand for gaming applications is acting as a catalyst for haptic technology market demand.
The adoption of haptic technology structures in the medical sector to train doctors in various surgical procedures is providing impetus to the market. Moreover, the adoption of technologies like the Internet of Things (IoT) is expected to drive the market forward.
The companies specialise in motion subsystems and associated technologies, offering innovative solutions for automotive, industrial, and consumer markets.


Upto 15% Off
USD
$3999 $3599
$2499 $2249
$4999 $4249
$5999 $5099


*While we strive to always give you current and accurate information, the numbers depicted on the website are indicative and may differ from the actual numbers in the main report. At Expert Market Research, we aim to bring you the latest insights and trends in the market. Using our analyses and forecasts, stakeholders can understand the market dynamics, navigate challenges, and capitalize on opportunities to make data-driven strategic decisions.*
Get in touch with us for a customized solution tailored to your unique requirements and save upto 35%!
The global haptic technology market value is assessed to grow at a CAGR of 14.00% between 2026 and 2035.
The major drivers of the market include increasing digitisation, and the rising demands for consumer electronics devices.
The key trends guiding the growth of the market include the increasing rural penetration of internet in emerging economies and rapid improvements in technologies.
The market is broken down into North America, Europe, Asia Pacific, Latin America, the Middle East, and Africa.
The leading technologies in the market are resistive technology and captive technology, among others.
The significant components in the market are microcontrollers, drivers, actuators, and software, among others.
Based on feedback the market is divided into force and tactile.
The various applications in the market are automotive and transportation, consumer electronics, education and research, healthcare, engineering, and gaming, among others.
The competitive landscape consists of Immersion Corporation, Johnson Electric Holdings Limited, Force Dimension, 3D Systems, Inc., and Ultraleap Limited, among others.
Explore our key highlights of the report and gain a concise overview of key findings, trends, and actionable insights that will empower your strategic decisions.
| REPORT FEATURES | DETAILS |
| Base Year | 2025 |
| Historical Period | 2019-2025 |
| Forecast Period | 2026-2035 |
| Scope of the Report |
Historical and Forecast Trends, Industry Drivers and Constraints, Historical and Forecast Market Analysis by Segment:
|
| Breakup by Technology |
|
| Breakup by Component |
|
| Breakup by Feedback |
|
| Breakup by Application |
|
| Breakup by Region |
|
| Market Dynamics |
|
| Competitive Landscape |
|
| Companies Covered |
|
| Report Price and Purchase Option | Explore our purchase options that are best suited to your resources and industry needs. |
| Delivery Format | Delivered as an attached PDF and Excel through email, with an option of receiving an editable PPT, according to the purchase option. |
Single User License
One User
USD 3,999
USD 3,599
tax inclusive*
Datasheet
One User
USD 2,499
USD 2,249
tax inclusive*
Five User License
Five User
USD 4,999
USD 4,249
tax inclusive*
Corporate License
Unlimited Users
USD 5,999
USD 5,099
tax inclusive*
*Please note that the prices mentioned below are starting prices for each bundle type. Kindly contact our team for further details.*
Flash Bundle
Small Business Bundle
Growth Bundle
Enterprise Bundle
*Please note that the prices mentioned below are starting prices for each bundle type. Kindly contact our team for further details.*
Flash Bundle
Number of Reports: 3
20%
tax inclusive*
Small Business Bundle
Number of Reports: 5
25%
tax inclusive*
Growth Bundle
Number of Reports: 8
30%
tax inclusive*
Enterprise Bundle
Number of Reports: 10
35%
tax inclusive*
How To Order

Select License Type
Choose the right license for your needs and access rights.

Click on ‘Buy Now’
Add the report to your cart with one click and proceed to register.

Select Mode of Payment
Choose a payment option for a secure checkout. You will be redirected accordingly.
Gain insights to stay ahead and seize opportunities.

Get insights & trends for a competitive edge.

Track prices with detailed trend reports.

Analyse trade data for supply chain insights.

Leverage cost reports for smart savings

Enhance supply chain with partnerships.

Connect For More Information
Our expert team of analysts will offer full support and resolve any queries regarding the report, before and after the purchase.
Our expert team of analysts will offer full support and resolve any queries regarding the report, before and after the purchase.
We employ meticulous research methods, blending advanced analytics and expert insights to deliver accurate, actionable industry intelligence, staying ahead of competitors.
Our skilled analysts offer unparalleled competitive advantage with detailed insights on current and emerging markets, ensuring your strategic edge.
We offer an in-depth yet simplified presentation of industry insights and analysis to meet your specific requirements effectively.


Share