

Consumer Insights
Uncover trends and behaviors shaping consumer choices today
Procurement Insights
Optimize your sourcing strategy with key market data
Industry Stats
Stay ahead with the latest trends and market analysis.

The geographic atrophy market was valued at USD 25.47 Billion in 2025, driven by the increasing prevalence of geographic atrophy and the rising regulatory approval of new therapeutic agents across the 8 major markets. The market is expected to grow at a CAGR of 5.70% during the forecast period of 2026-2035, with the values likely to reach USD 44.34 Billion by 2035.
Base Year
Historical Period
Forecast Period
The increasing number of patients affected by geographic atrophy and the growing aging population are poised to fuel the market demand.
One of the major market trends is the rising strategic collaborations and acquisitions between the key market players in order to accelerate the development of new treatments and expand their product portfolios.
Increased focus on the clinical development of biologics and gene therapy solutions to treat geographic atrophy is projected to propel market growth.
Compound Annual Growth Rate
5.7%
Value in USD Billion
2026-2035
*this image is indicative*
Geographic atrophy (GA) is the atrophic late form of age-related macular degeneration (AMD) and causes the destruction of retinal cells responsible for vision. It is reported to affect over 1 million individuals in the United States and around 5 million individuals globally. This progressive condition is predominantly found in older adults. Thus, as the aging population increases, the demand for the geographic atrophy market is expected to witness a surge.
The market is influenced by the growing awareness regarding this severe eye disease and its impact on vision. This is prompting more patients to seek early diagnosis and treatment. The growth in new drug approvals by regulatory bodies such as the FDA and EMA is also anticipated to aid in the market expansion. Moreover, factors such as significant investment in research and development in the retinal ophthalmology field, increased strategic partnerships among biotech and pharmaceutical companies, and advancements in diagnostic tools are expected to drive market growth.
Increasing Prevalence of Geographic Atrophy Drives Market Growth
Recent data suggests that 1 out of 5 individuals aged 85 or more are affected by geographic atrophy in at least one eye. Bilateral geographic atrophy is reported to result in severe visual impairment, with a substantial burden on patients as well as healthcare providers. Although the prevalence and incidence of this eye disease varies across different regions, it is estimated that the highest burden of geographic atrophy is found in European ancestry. The increasing aging population is one of the primary drivers of the growing cases of this retinal disorder, which is anticipated to bolster market growth in the coming years.
Rise in Drug Approvals to Meet Rising Geographic Atrophy Market Demand
In February 2023, global biopharma company Apellis Pharmaceuticals, Inc. announced that the United States Food and Drug Administration (FDA) granted approval to its drug SYFOVRE™ (pegcetacoplan injection) indicated for geographic atrophy (GA) secondary to age-related macular degeneration (AMD). The regulatory approval, based on the positive results from the Phase 3 OAKS and DERBY clinical studies, marked a milestone in the field of retinal ophthalmology, with SYFOVRE being the first FDA-cleared treatment for geographic atrophy. The rise in such regulatory approvals is set to fuel the market growth.
The market is witnessing several trends and developments to improve the current scenario. Some of the notable trends are as follows:
The EMR’s report titled “Geographic Atrophy Market Report and Forecast 2026-2035 offers a detailed analysis of the market based on the following segments:
Market Breakup by Age Group
Market Breakup by Treatment
Market Breakup by Distribution Channel
Market Breakup by Region
Distribution Channel Segment is Projected to Fuel Market Growth
Based on the distribution channel, the market is segmented into hospital pharmacy, retail pharmacy, online pharmacy, and others. Hospital pharmacies cover a significant market share as they offer immediate access to medications for geographic atrophy in hospital settings. The online pharmacy segment is a growing market segment that allows patients to place orders for their medications remotely. Online pharmacies provide convenience and home delivery services and thus are gaining demand in the market.
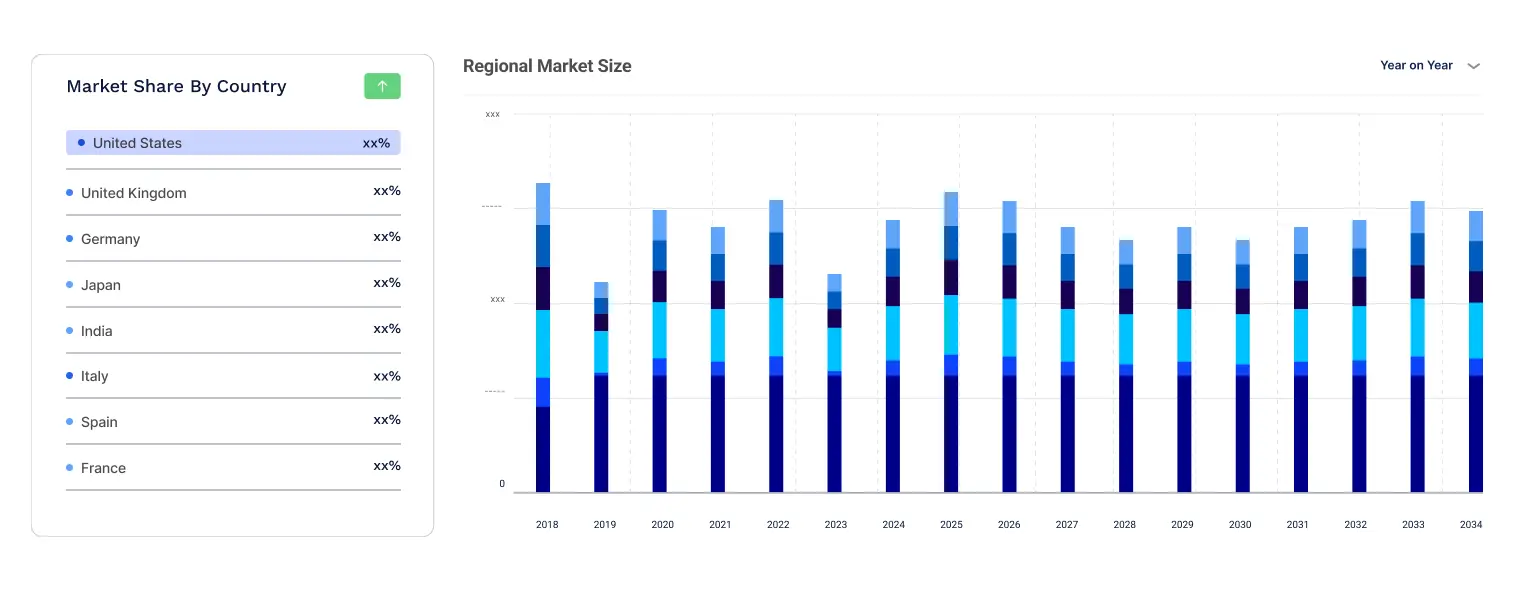
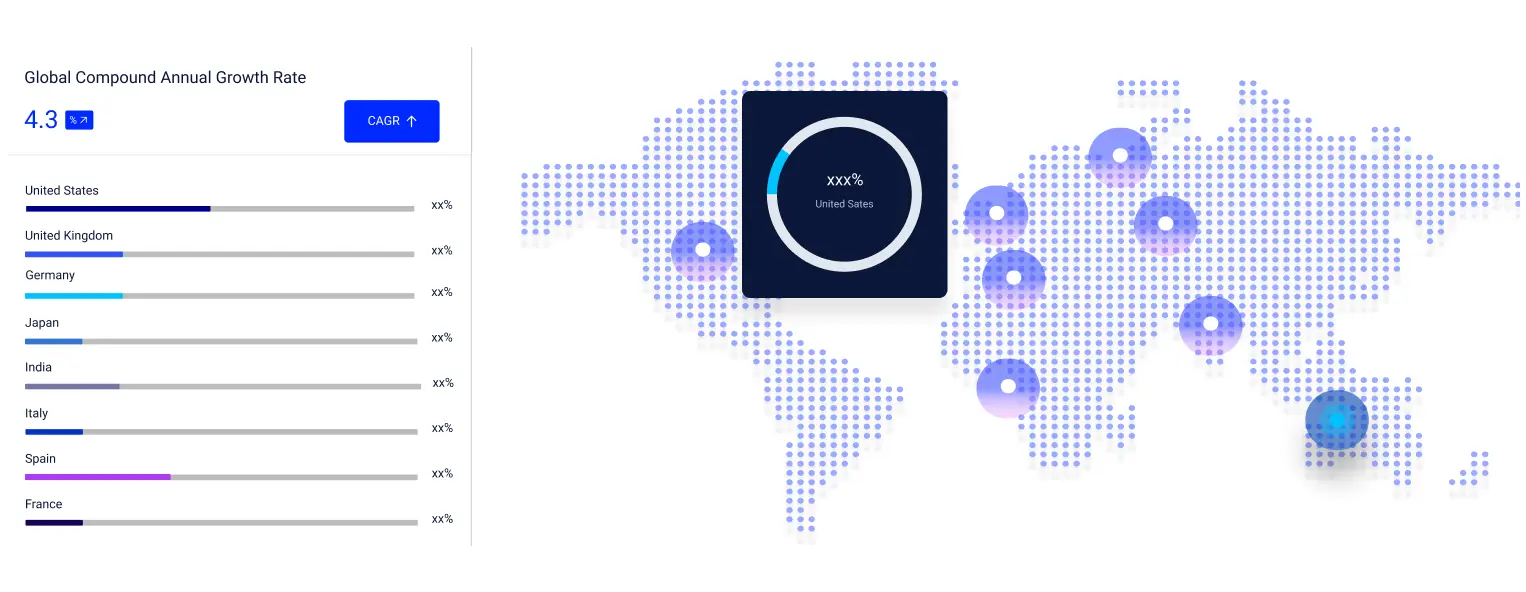
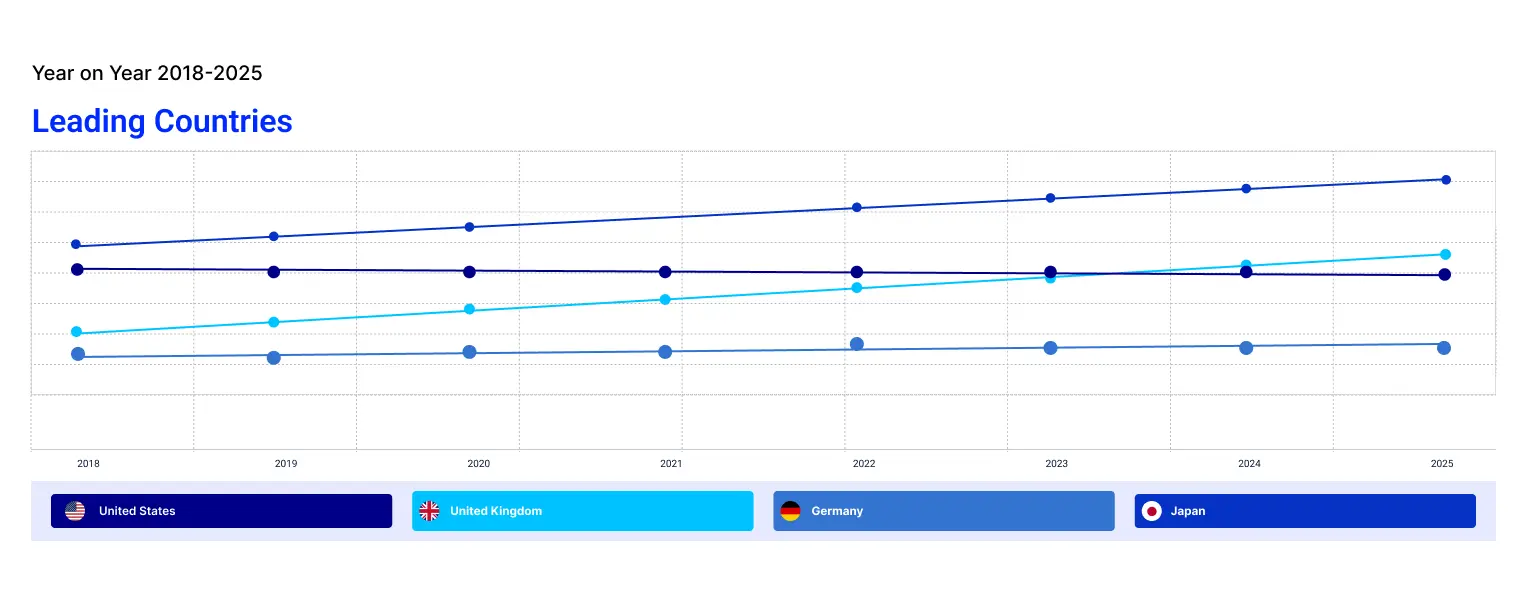
Based on the region, the market includes the United States, EU-4 (Germany, France, Italy, Spain), and the United Kingdom, Japan, and India. The United States represents a significant market share owing to the large population in the region affected by age-related macular degeneration (AMD), including geographic atrophy. The market growth is supported by increased access to advanced therapies and the presence of a positive regulatory environment that ensures faster market entry for new treatments.
The key features of the market report comprise the patent analysis, clinical trial analysis, grant analysis, and strategic initiatives by the leading key players. The major companies in the market are as follows:
Based in Massachusetts, United States, Apellis Pharmaceuticals is a clinical-stage biopharmaceutical company that is one of the leading players in the market. The company developed the first-ever treatment for geographic atrophy, SYFOVRE™ (pegcetacoplan injection), which the FDA approved in February 2023.
Iveric Bio, a part of Japan's Astellas Pharma, has a robust presence in the market and specializes in developing novel therapeutics for ophthalmic diseases. In August 2023, its therapy IZERVAY™ (avacincaptad pegol intravitreal solution) received FDA clearance for the treatment of geographic atrophy.
United States-based Alkeus Pharmaceuticals Inc., a late-stage biopharmaceutical company, is known for developing therapies against serious and untreatable eye diseases. Its lead candidate Gildeuretinol acetate (ALK-001) is undergoing clinical development for geographic atrophy and Stargardt's disease.
Privately owned biotechnology company Hemera Biosciences is known for developing gene therapy to treat patients with age-related macular degeneration (AMD). The firm has developed drug candidate HMR59, a gene therapy designed to increase the expression of CD59, which has the potential to preserve vision in geographic atrophy patients.
*Please note that this is only a partial list; the complete list of key players is available in the full report. Additionally, the list of key players can be customized to better suit your needs.*
Other key players in the market include Allegro Ophthalmics, Stealth BioTherapeutics, Novartis AG, Regenerative Patch Technologies, LLC, F. Hoffmann-La Roche AG, Gensight Biologics, NGM Biopharmaceuticals, AstraZeneca PLC, and Lineage Cell Therapeutics.


Upto 15% Off
USD
$5499 $4949
$3299 $2969
$6999 $5949
$8199 $6969


*While we strive to always give you current and accurate information, the numbers depicted on the website are indicative and may differ from the actual numbers in the main report. At Expert Market Research, we aim to bring you the latest insights and trends in the market. Using our analyses and forecasts, stakeholders can understand the market dynamics, navigate challenges, and capitalize on opportunities to make data-driven strategic decisions.*
Get in touch with us for a customized solution tailored to your unique requirements and save upto 35%!
Explore our key highlights of the report and gain a concise overview of key findings, trends, and actionable insights that will empower your strategic decisions.
| REPORT FEATURES | DETAILS |
| Base Year | 2025 |
| Historical Period | 2019-2025 |
| Forecast Period | 2026-2035 |
| Scope of the Report |
Historical and Forecast Trends, Industry Drivers and Constraints, Historical and Forecast Market Analysis by Segment:
|
| Breakup by Age Group |
|
| Breakup by Treatment |
|
| Breakup by Distribution Channel |
|
| Breakup by Region |
|
| Market Dynamics |
|
| Supplier Landscape |
|
| Companies Covered |
|
Single User License
One User
USD 5,499
USD 4,949
tax inclusive*
Datasheet
One User
USD 3,299
USD 2,969
tax inclusive*
Five User License
Five User
USD 6,999
USD 5,949
tax inclusive*
Corporate License
Unlimited Users
USD 8,199
USD 6,969
tax inclusive*
*Please note that the prices mentioned below are starting prices for each bundle type. Kindly contact our team for further details.*
Flash Bundle
Small Business Bundle
Growth Bundle
Enterprise Bundle
*Please note that the prices mentioned below are starting prices for each bundle type. Kindly contact our team for further details.*
Flash Bundle
Number of Reports: 3
20%
tax inclusive*
Small Business Bundle
Number of Reports: 5
25%
tax inclusive*
Growth Bundle
Number of Reports: 8
30%
tax inclusive*
Enterprise Bundle
Number of Reports: 10
35%
tax inclusive*
How To Order

Select License Type
Choose the right license for your needs and access rights.

Click on ‘Buy Now’
Add the report to your cart with one click and proceed to register.

Select Mode of Payment
Choose a payment option for a secure checkout. You will be redirected accordingly.
Gain insights to stay ahead and seize opportunities.

Get insights & trends for a competitive edge.

Track prices with detailed trend reports.

Analyse trade data for supply chain insights.

Leverage cost reports for smart savings

Enhance supply chain with partnerships.

Connect For More Information
Our expert team of analysts will offer full support and resolve any queries regarding the report, before and after the purchase.
Our expert team of analysts will offer full support and resolve any queries regarding the report, before and after the purchase.
We employ meticulous research methods, blending advanced analytics and expert insights to deliver accurate, actionable industry intelligence, staying ahead of competitors.
Our skilled analysts offer unparalleled competitive advantage with detailed insights on current and emerging markets, ensuring your strategic edge.
We offer an in-depth yet simplified presentation of industry insights and analysis to meet your specific requirements effectively.


Share