Explore Our Diverse Range Of Offerings
From detailed reports to experts services offered in 15+ Industry Domains
Report
Press Release
Blogs
Industry Statistics
Add 2 More Reports For 20% off

Report Overview

The gastric cancer market was valued at USD 4.70 Billion in 2024, driven by growth in clinical trials and research across the 8 major markets. The market is expected to grow at a CAGR of 12.63% during the forecast period of 2025-2034, with the values likely to reach USD 15.44 Billion by 2034.

2024

Base Year

2018-2024

Historical Year

2025-2034

Forecast Year

  • The increasing prevalence of gastric cancer owing to factors such as the growing aging population and lifestyle-related risks is leading to a higher demand for effective treatments.

  • The rising number of clinical trials investigating the efficacy of novel therapies and drug combinations is a significant market trend.

  • The growing trend toward personalized medicine and the increasing funding for cancer research is shaping the market landscape.

Compound Annual Growth Rate

Value in USD Billion

12.63%

2025-2034


Gastric Cancer Market Outlook

*this image is indicative*

Gastric Cancer Market Overview

Gastric or stomach cancer refers to a cancerous growth that occurs in the cells lining the stomach. It ranks as the third leading cause of cancer deaths and is estimated to be the fifth most frequently diagnosed cancer . Factors such as aging populations, especially in countries in Japan, and the rising lifestyle-related risks such as diet and smoking are contributing to the growing incidence of gastric cancer, which propels the market demand for effective treatments. The rising development of advanced treatment options like immunotherapies and minimally invasive surgical techniques supports the market growth. Further, the shift towards personalized medicine driven by advancements in genomics and molecular biology is anticipated to influence the market dynamics significantly.

Gastric Cancer Market Growth Drivers

Increasing Prevalence of Gastric Cancer Drives Market Growth

According to the American Cancer  Society, around 26,890 new cases of stomach cancer and approximately 10,880 cases of deaths are estimated to occur in the United States in 2024. Further, stomach cancer is reported to account for 1.5% of all new cancer cases diagnosed in the United States annually. Recent data suggests that older adults are at a high risk of developing stomach cancer, with about 6 in every 10 individuals diagnosed with this cancer falling in the age category of 65 or above. Thus, the substantial burden of gastric cancer along with the increasing aging population is expected to drive the market growth in the coming years.

Gastric Cancer Market Trends

Gastric Cancer Market Segmentation

Market Breakup by Treatment Type

  • Chemotherapy
  • Immunotherapy
  • Surgery
  • Targeted Drug Therapy
  • Others

Market Breakup by Cancer Type

  • Adenocarcinoma
  • Gastrointestinal Stromal Tumor
  • Carcinoid Tumor
  • Others

Market Breakup by Route of Administration

  • Oral
  • Parenteral
  • Others

Market Breakup by End User

  • Hospitals & Clinics
  • Diagnostic Centers
  • Research Laboratories
  • Others

Market Breakup by Region

  • United States
  • EU-4 and the United Kingdom
    • Germany
    • France
    • Italy
    • Spain
    • United Kingdom
  • Japan
  • India

Gastric Cancer Market Share

Market Segmentation Based on Treatment Type is Anticipated to Witness Substantial Growth

Based on the treatment type, the market is segmented into chemotherapy, immunotherapy, surgery, targeted drug therapy, and others. The chemotherapy segment represents a significant share of the market as this treatment finds its application across various stages of gastric cancer. Chemotherapy is often recommended as a first-line treatment, either alone or in combination with other therapies such as surgery and targeted drug therapy. It can help in shrinking tumors before surgery and also can manage symptoms in advanced stages of cancer and thus, is one of the most commonly utilized treatment options in the market.

Gastric Cancer Market Analysis by Region

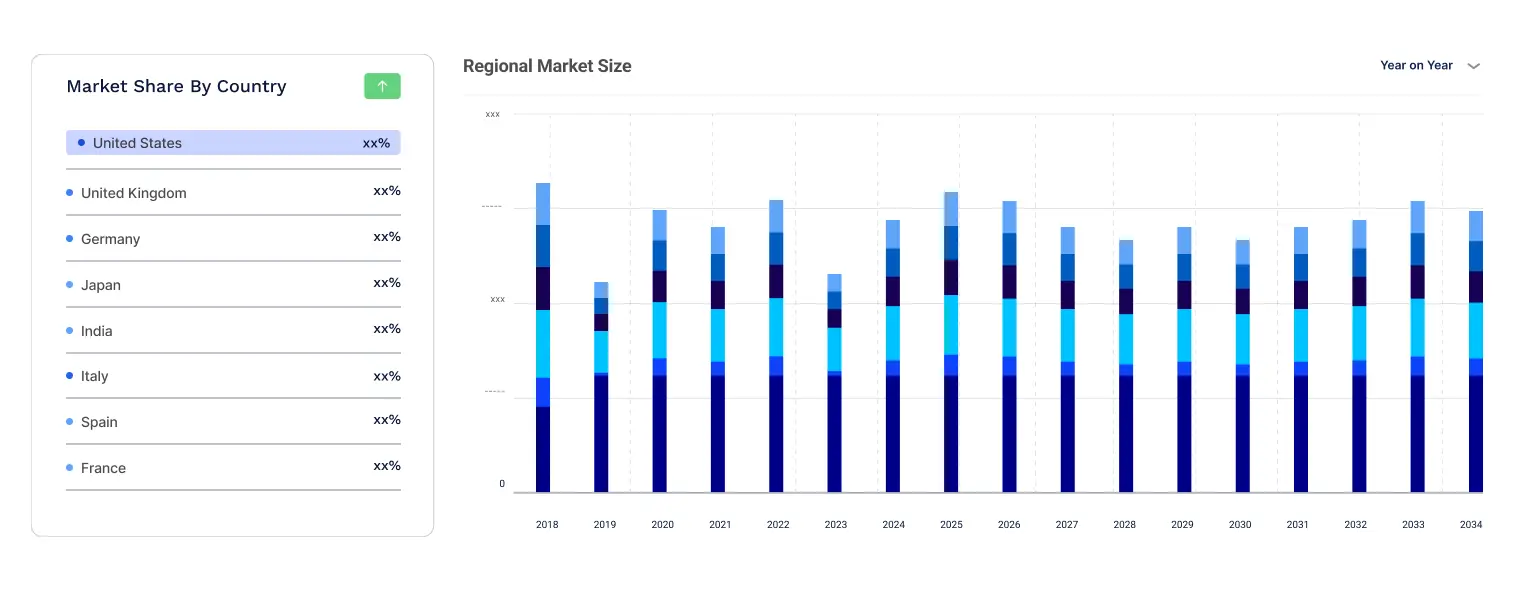
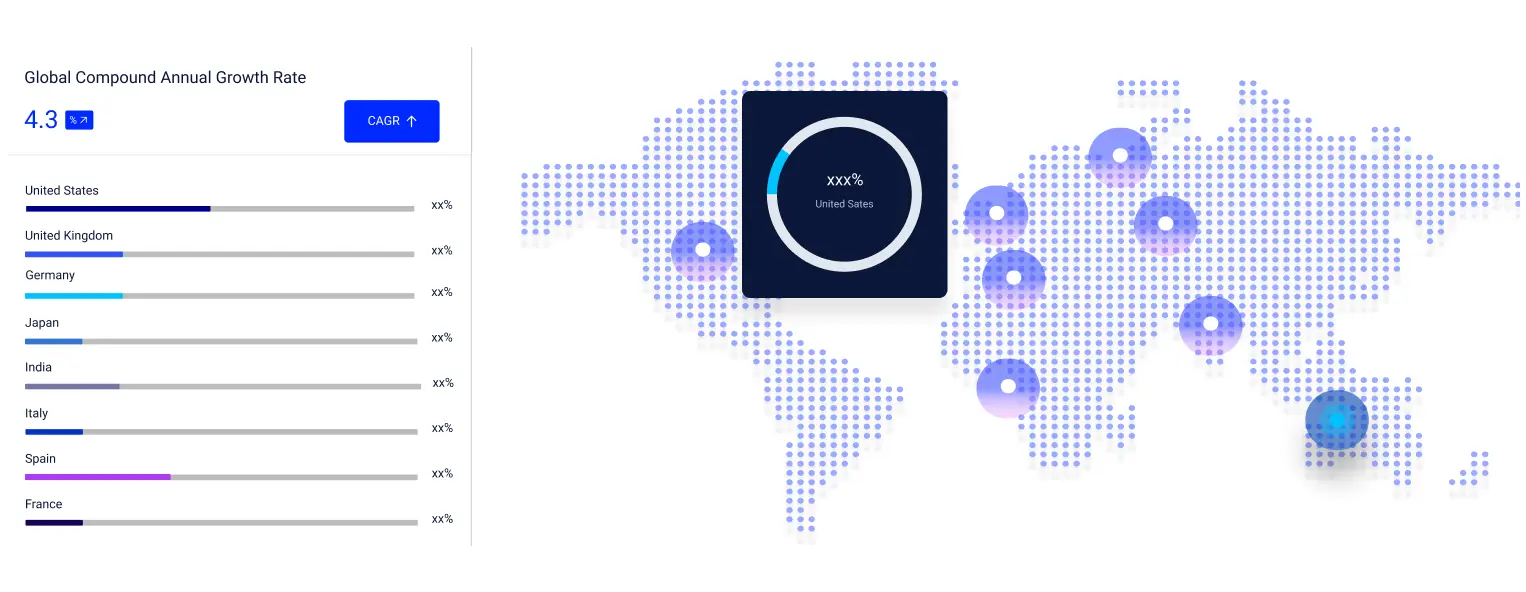
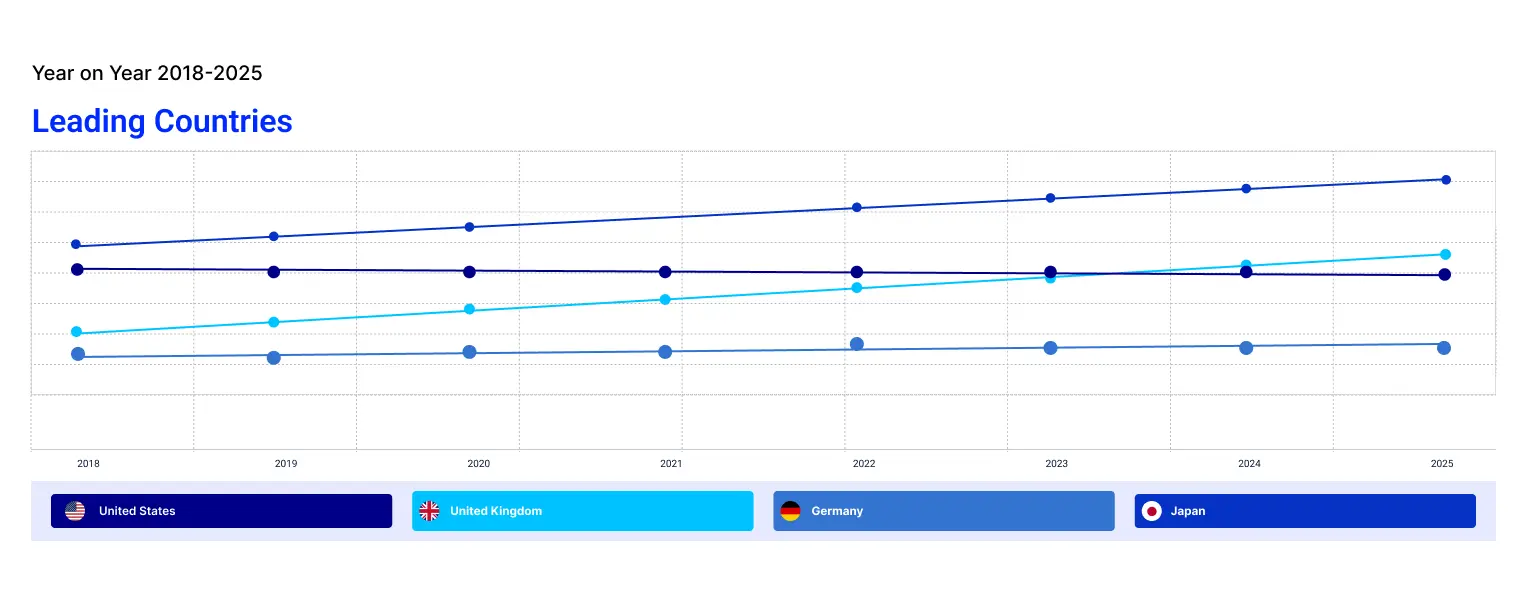
The market segmentation by region includes the United States, EU-4 (Germany, France, Italy, Spain), and the United Kingdom, Japan, and India. The United States holds a major market share for gastric cancer, owing to the high prevalence of the disease and advanced healthcare infrastructure. The robust research and development activities directed at finding innovative therapies for gastric cancer further aid the market growth in the region.


Additionally, the presence of key pharmaceutical companies and substantial demand for advanced treatment modalities such as immunotherapy and targeted drug therapies contribute to the expansion of the market. Moreover, the increasing investment in cancer research by both the United States government and private sectors is poised to fuel the growth and innovation in the market in the forecast period.

Leading Players in the Gastric Cancer Market

The key features of the market report comprise patent analysis, clinical trials analysis, grants analysis, funding and investment analysis, and strategic initiatives by the leading key players. The major companies in the market are as follows:

AstraZeneca

AstraZeneca, a global research-based biopharmaceutical firm, has a prominent presence in the market. The company boasts a diverese portfolio of oncology drugs that target different aspects of cancer growth and progression. AstraZeneca's human monoclonal antibody Imfinzi (durvalumab)  in combination with chemotherapy is being investigated for its effectiveness in treating gastric cancer.

Pfizer, Inc.

Pfizer, Inc., headquartered in New York, United States, is a major market player focused on expanding its oncology portfolio. The company is actively engaged in exploring innovative treatments that address various cancer types, including gastric cancer. Pfizer has several ongoing clinical trials to investigate the efficacy of new treatment combinations and to expand the indications of its existing oncology drugs.

Novartis AG

Pharmaceutical corporation Novartis AG, based in Basel, Switzerland, is one of the leading companies in the market. The company is investing heavily in developing new therapies for gastric cancer including drugs that target specific molecular pathways involved in cancer growth.

*Please note that this is only a partial list; the complete list of key players is available in the full report. Additionally, the list of key players can be customized to better suit your needs.*

Other key players in the market include Amgen Inc., Bristol-Myers Squibb Company, Eli Lily and Company, Celltrion, AbbVie Inc., and GSK plc.

Key Questions Answered in the Gastric Cancer Market Report

  • What was the gastric cancer market value in 2024?
  • What is the gastric cancer market forecast outlook for 2025-2034?
  • What are the regional markets covered in the EMR report?
  • What is market segmentation based on treatment type?
  • What is the market breakup based on cancer type?
  • What is the market breakup by route of administration?
  • Who are the major end users in the market?
  • What are the major factors aiding the gastric cancer market demand? 
  • How has the market performed so far and how is it anticipated to perform in the coming years?
  • What are the market's major drivers, opportunities, and restraints? 
  • Which regional market is expected to lead the market share in the forecast period? 
  • Which country is expected to experience expedited growth during the forecast period? 
  • How do the prevalence and incidence of gastric cancer affect the market landscape?
  • What are the major gastric cancer market trends?
  • How does the growth in clinical trials impact the market size?
  • Which treatment type will dominate the market share? 
  • Which cancer type is expected to have a high market value in the coming years?
  • Which route of administration will experience the highest demand in the market segment?
  • Which end user is projected to contribute to the highest market growth?
  • Who are the key players involved in the gastric cancer market?
  • What is the patent landscape of the market?
  • What are the current unmet needs and challenges in the market?
  • How are partnerships, collaborations, and mergers & acquisitions among the key market players shaping the market dynamics?

*While we strive to always give you current and accurate information, the numbers depicted on the website are indicative and may differ from the actual numbers in the main report. At Expert Market Research, we aim to bring you the latest insights and trends in the market. Using our analyses and forecasts, stakeholders can understand the market dynamics, navigate challenges, and capitalize on opportunities to make data-driven strategic decisions.*

Looking for specific insights?

Get in touch with us for a customized solution tailored to your unique requirements and save upto 35%!

Report Summary

Explore our key highlights of the report and gain a concise overview of key findings, trends, and actionable insights that will empower your strategic decisions.

Key Highlights of the Report

Please note that the figures mentioned in the description serve as estimates and may vary from the actual figures presented in the final report.

REPORT FEATURES DETAILS
Base Year 2024
Historical Period 2018-2024
Forecast Period 2025-2034
Scope of the Report

Historical and Forecast Trends, Industry Drivers and Constraints, Historical and Forecast Market Analysis by Segment:

  • Treatment Type
  • Cancer Type
  • Route of Administration
  • End User
  • Region
Breakup by Treatment Type
  • Chemotherapy
  • Immunotherapy
  • Surgery
  • Targeted Drug Therapy
  • Others
Breakup by Cancer Type
  • Adenocarcinoma
  • Gastrointestinal Stromal Tumor
  • Carcinoid Tumor
  • Others
Breakup by Route of Administration
  • Oral
  • Parenteral
  • Others
Breakup by End User
  • Hospitals & Clinics
  • Diagnostic Centers
  • Research Laboratories
  • Others
Breakup by Region
  • United States
  • EU-4 and the United Kingdom
  • Japan
  • India


Market Dynamics
  • Market Drivers and Constraints
  • SWOT Analysis
  • Porter’s Five Forces Model 
  • Key Demand Indicators
  • Key Price Indicators
  • Industry Events, Initiatives, and Trends 
  • Value Chain Analysis
Supplier Landscape
  • Market Structure
  • Company Profiles
    • Financial Analysis
    • Product Portfolio
    • Demographic Reach and Achievements
    • Mergers and Acquisitions
    • Certifications
Companies Covered
  • AstraZeneca 
  • Pfizer, Inc.
  • Novartis AG 
  • Amgen Inc. 
  • Bristol-Myers Squibb Company 
  • Eli Lily and Company 
  • Celltrion
  • AbbVie Inc
  • GSK plc 

Datasheet

10 % Off

USD

3,299

2,969

Single User License

10 % Off

USD

5,499

4,969

Five User License

15 % Off

USD

6,999

5,949

Corporate License

15 % Off

USD

8,199

6,969

  • Report Delivery
  • Purchase Advantages
  • Access Duration
  • Analyst Support
  • Discount on Future Updates
  • Customisation Options
  • Customisation Requests
  • Excel Data Sheet
  • Online Access
  • PDF Format
  • PPT/Word Format
  • 1 Print Allowed
  • Bulk Purchase Discounts
  • Full Report Access
  • Multi-Device Access
  • Unlimited Access
  • One-Time Purchase
  • 3-Month Trade Data Access
  • Consultation Hours
  • Email Support
  • Phone Support
  • Up to 15 Analyst Hours
  • Up to 30 Analyst Hours
  • 5% Discount
  • 10% Discount
  • 15% Discount
  • 20% Discount
  • Basic (Up to 10%)
  • Advanced (Up to 50%)
  • Dedicated Analyst Access
  • Data Visualization Access
  • Custom Data Queries
  • Custom Report Layouts
  • Tailored Custom Summaries
  • Dashboard
  • Purchase Advantages
  • Report Delivery
  • Access Duration
  • Analyst Support
  • Discount on Future Updates
  • Customisation Options
  • Customisation Requests
  • 1 Print Allowed
  • Full Report Access
  • Bulk Purchase Discounts
  • Multi-Device Access
  • PDF Format
  • Online Access
  • Excel Data Sheet
  • PPT/Word Format
  • Unlimited Access
  • One-Time Purchase
  • 3-Month Trade Data Access
  • Consultation Hours
  • Email Support
  • Phone Support
  • Up to 15 Analyst Hours
  • Up to 30 Analyst Hours
  • 5% Discount
  • 10% Discount
  • 15% Discount
  • 20% Discount
  • Basic (Up to 10%)
  • Advanced (Up to 50%)
  • Dedicated Analyst Access
  • Data Visualization Access
  • Custom Data Queries
  • Custom Report Layouts
  • Tailored Custom Summaries
  • Dashboard
  • Purchase Advantages
  • Analyst Support
  • Report Delivery
  • Access Duration
  • Customisation Options
  • Discount on Future Updates
  • Customisation Requests
  • 5 Prints Allowed
  • Full Report Access
  • Bulk Purchase Discounts
  • Limited Device Access
  • Email Support
  • Phone Support
  • Up to 15 Analyst Hours
  • Up to 30 Analyst Hours
  • PDF Format
  • Online Access
  • Excel Data Sheet
  • PPT/Word Format
  • Unlimited Access
  • One-Time Purchase
  • 3-Month Trade Data Access
  • Consultation Hours
  • Basic (Up to 10%)
  • Advanced (Up to 50%)
  • Dedicated Analyst Access
  • Data Visualization Access
  • 5% Discount
  • 10% Discount
  • 15% Discount
  • 20% Discount
  • Custom Data Queries
  • Custom Report Layouts
  • Tailored Custom Summaries
  • Dashboard
  • Report Delivery
  • Purchase Advantages
  • Customisation Options
  • Customisation Requests
  • Analyst Support
  • Access Duration
  • Discount on Future Updates
  • PDF Format
  • Excel Data Sheet
  • PPT/Word Format
  • Online Access
  • Unlimited Prints Available
  • Full Report Access
  • Bulk Purchase Discounts
  • Multi-Device Access
  • Basic (Up to 10%)
  • Advanced (Up to 50%)
  • Dedicated Analyst Access
  • Data Visualization Access
  • Custom Data Queries
  • Custom Report Layouts
  • Tailored Custom Summaries
  • Dashboard
  • Email Support
  • Phone Support
  • Up to 15 Analyst Hours
  • Up to 30 Analyst Hours
  • Unlimited Access
  • One-Time Purchase
  • 3-Month Trade Data Access
  • Consultation Hours
  • 5% Discount
  • 10% Discount
  • 15% Discount
  • 20% Discount

Datasheet

One User

USD 3,299

USD 2,969

tax inclusive*

  • Selected Segments
  • Printing Restrictions
  • Excel Spreadsheet Delivered via Email
  • Full Report
  • Periodic Updates
  • Post Sales Analysts Support
  • Unlimited Prints

Single User License

One User

USD 5,499

USD 4,969

tax inclusive*

  • All Segments
  • Printing Restrictions
  • PDF Delivered via Email
  • Custom Report Layout
  • Post Sales Analysts Support
  • Periodic Updates
  • Unlimited Prints

Five User License

Five User

USD 6,999

USD 5,949

tax inclusive*

  • All Segments
  • Five Prints Available
  • PDF Delivered via Email
  • Limited Free Customization
  • Post Sales Analyst Support
  • Custom Report Layout
  • Periodic Updates
  • Unlimited Prints

Corporate License

Unlimited Users

USD 8,199

USD 6,969

tax inclusive*

  • All Segments
  • Unlimited Prints Available
  • PDF & Excel Delivery via Email
  • Limited Free Customization
  • Post Sales Analysts Support
  • Discount On Next Update
  • Custom Report Layout

*Please note that the prices mentioned below are starting prices for each bundle type. Kindly contact our team for further details.*

Bundle Type

Flash Bundle

20% OFF Number of Reports: 3

Small Business Bundle

25% OFF Number of Reports: 5

Growth Bundle

30% OFF Number of Reports: 8

Enterprise Bundle

35% OFF Number of Reports: 10
Overview
  • Life Time Access
  • Analyst Support Related to Report
  • PDF Version of the Report
  • Complimentary Excel Data Set
  • Free Analyst Hours
  • Complimentary Free 1 Month Subscription to Trade Data Base
  • Complimentary One Month Subscription to Price Database (Chemicals only)
  • Complementary PPT Version of the Report
  • Complimentary License Upgrade
  • Complimentary Power BI Dashboards
  • Life Time Access
  • Analyst Support Related to Report
  • PDF Version of the Report
  • Complimentary Excel Data Set
  • Free Analyst Hours - 50 Hours
  • Complimentary Free 1 Month Subscription to Trade Data Base
  • Complimentary One Month Subscription to Price Database (Chemicals only)
  • Complementary PPT Version of the Report
  • Complimentary License Upgrade
  • Complimentary Power BI Dashboards
  • Life Time Access
  • Analyst Support Related to Report
  • PDF Version of the Report
  • Complimentary Excel Data Set
  • Free Analyst Hours - 80 Hours
  • Complimentary Free 1 Month Subscription to Trade Data Base
  • Complimentary One Month Subscription to Price Database (Chemicals only)
  • Complementary PPT Version of the Report
  • Complimentary License Upgrade
  • Complimentary Power BI Dashboards
  • Life Time Access
  • Analyst Support Related to Report
  • PDF Version of the Report
  • Complimentary Excel Data Set
  • Free Analyst Hours - 100 Hours
  • Complimentary Free 1 Month Subscription to Trade Data Base
  • Complimentary One Month Subscription to Price Database (Chemicals only)
  • Complementary PPT Version of the Report
  • Complimentary License Upgrade
  • Complimentary Power BI Dashboards

*Please note that the prices mentioned below are starting prices for each bundle type. Kindly contact our team for further details.*

Flash Bundle

Number of Reports: 3

20%

tax inclusive*

  • 3 Reports Included
  • Life Time Acess
  • Analyst Support Related to Report
  • PDF Version of the Report
  • Free 1 Month Subscription to Trade Data Base
  • 1 Month Subscription to Price Database (Chemicals only)
  • Complimentary Excel Data Set
  • PPT Version of the Report
  • Power BI Dashboards
  • License Upgrade
  • Free Analyst Hours

Small Business Bundle

Number of Reports: 5

25%

tax inclusive*

  • 5 Reports Included
  • Life Time Acess
  • Analyst Support Related to Report
  • PDF Version of the Report
  • Complimentary Excel Data Set
  • Free Analyst Hours - 50 Hours
  • Free 1 Month Subscription to Trade Data Base
  • 1 Month Subscription to Price Database (Chemicals only)
  • Complimentary Excel Data Set
  • PPT Version of the Report
  • Power BI Dashboards
  • License Upgrade

Growth Bundle

Number of Reports: 8

30%

tax inclusive*

  • 8 Reports Included
  • Life Time Acess
  • Analyst Support Related to Report
  • PDF Version of the Report
  • Complimentary Excel Data Set
  • Free Analyst Hours - 50 Hours
  • Free 1 Month Subscription to Trade Data Base
  • 1 Month Subscription to Price Database (Chemicals only)
  • License Upgrade
  • Free Analyst Hours - 80 Hours
  • Power BI Dashboards

Enterprise Bundle

Number of Reports: 10

35%

tax inclusive*

  • 10 Reports Included
  • Life Time Acess
  • Analyst Support Related to Report
  • PDF Version of the Report
  • Complimentary Excel Data Set
  • Free Analyst Hours - 50 Hours
  • Free 1 Month Subscription to Trade Data Base
  • 1 Month Subscription to Price Database (Chemicals only)
  • License Upgrade
  • Power BI Dashboards
  • Free Analyst Hours - 100 Hours

How To Order

Our step-by-step guide will help you select, purchase, and access your reports swiftly, ensuring you get the information that drives your decisions, right when you need it.

Select License Type

Choose the right license for your needs and access rights.

Click on ‘Buy Now’

Add the report to your cart with one click and proceed to register.

Select Mode of Payment

Choose a payment option for a secure checkout. You will be redirected accordingly.

Strategic Solutions for Informed Decision-Making

Connect For More Information

Our expert team of analysts will offer full support and resolve any queries regarding the report, before and after the purchase.

Our expert team of analysts will offer full support and resolve any queries regarding the report, before and after the purchase.

We employ meticulous research methods, blending advanced analytics and expert insights to deliver accurate, actionable industry intelligence, staying ahead of competitors.

Our skilled analysts offer unparalleled competitive advantage with detailed insights on current and emerging markets, ensuring your strategic edge.

We offer an in-depth yet simplified presentation of industry insights and analysis to meet your specific requirements effectively.

We’re here to help answer any questions about our products and services.

Contact us

Our Offices


Australia

63 Fiona Drive, Tamworth, NSW

+61-448-061-727

India

C130 Sector 2 Noida, Uttar Pradesh 201301

+91-723-689-1189

Philippines

40th Floor, PBCom Tower, 6795 Ayala Avenue Cor V.A Rufino St. Makati City,1226.

+63-287-899-028, +63-967-048-3306

United Kingdom

6 Gardner Place, Becketts Close, Feltham TW14 0BX, Greater London

+44-753-713-2163

United States

30 North Gould Street, Sheridan, WY 82801

+1-415-325-5166

Vietnam

193/26/4 St.no.6, Ward Binh Hung Hoa, Binh Tan District, Ho Chi Minh City

+84-865-399-124

30 North Gould Street, Sheridan, WY 82801

+1-415-325-5166

63 Fiona Drive, Tamworth, NSW

+61-448-061-727

C130 Sector 2 Noida, Uttar Pradesh 201301

+91-723-689-1189

40th Floor, PBCom Tower, 6795 Ayala Avenue Cor V.A Rufino St. Makati City, 1226.

+63-287-899-028, +63-967-048-3306

6 Gardner Place, Becketts Close, Feltham TW14 0BX, Greater London

+44-753-713-2163

193/26/4 St.no.6, Ward Binh Hung Hoa, Binh Tan District, Ho Chi Minh City

+84-865-399-124