

Consumer Insights
Uncover trends and behaviors shaping consumer choices today
Procurement Insights
Optimize your sourcing strategy with key market data
Industry Stats
Stay ahead with the latest trends and market analysis.

The global fish paste market reached a volume of 190.72 Million Tons in 2025. The market is projected to grow at a CAGR of 2.50% between 2026 and 2035 to reach nearly a volume of 244.14 Million Tons by 2035.
Base Year
Historical Period
Forecast Period
Compound Annual Growth Rate
2.5%
Value in Million Tons
2026-2035
*this image is indicative*
The Asia Pacific is expected to present a significant growth opportunity for the fish paste industry as a result of the rising customer per capita income and a growing understanding of a balanced dietary intake with adequate consumption of nutrients and proteins. A significant portion of the population in the region also relies on the source of seafood for their daily requirements of protein. This is expected to further add to the increasing demand for fish paste in the region. Within the Asia Pacific, Japan is expected to be a leading market for fish paste due to the country’s substantial seafood consumption. In Japan, the fish paste industry attained a value of USD 2.41 billion in 2020. The market for fish paste is also witnessing a significant growth in Japan due to the increasing focus of consumers on following a healthy lifestyle.


Fish paste refers to a soft, creamy paste or purée of fish that is produced through the chemical or physical break down of fish. A procedure known as fermentation involves the chemical treatment of fish, breaking it into fish paste. The physical method for preparing fish pastes involves the grinding, mincing, pressing, pounding, mixing, or shearing processes so that the fish is reduced to a paste consistency. The fish paste is cooked for long so that the desired degree of consistency and thickness is achieved. Seasonings or condiments for flavouring different foods and other delicacies are used for the fish paste. The paste is a rich source of vitamins and omega 3, consisting of low fat and high protein contents. In addition to this, fish is an excellent mineral source for the health of the heart and brain, for example, zinc, iron, magnesium, iodine, and potassium.
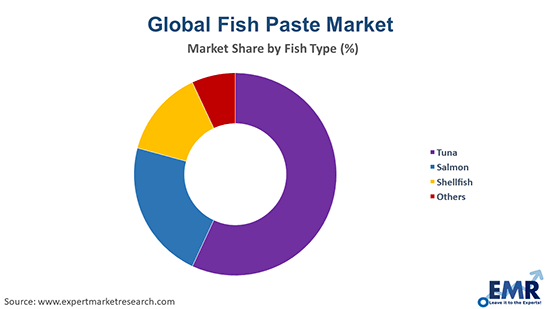
Based on fish type, the industry can be divided as follows:
Fish paste finds wide applications in the following sectors:
The distribution channels in the industry can be segmented as follows:
The regional markets for fish paste can be divided into:
Read more about this report - REQUEST FREE SAMPLE COPY IN PDF
Due to the increasing population, rising disposable incomes, rapid urbanisation, and a growing shift in food preferences, the demand for fish paste are expected to increase over the forecast year. The rising demand for nutritive foods is contributing to the increased seafood consumption, including fish paste. The growing industry for food processing is also boosting the market for fish paste as it is used in many culinary dishes such as snacks, sandwiches, soups, and spreads, among others.
The report gives a detailed analysis of the following key players in the global fish paste market, covering their competitive landscape, capacity, and latest developments like mergers, acquisitions, and investments, expansions of capacity, and plant turnarounds:
The comprehensive EMR report provides an in-depth assessment of the market based on the Porter's five forces model along with giving a SWOT analysis.


Upto 15% Off
USD
$2499 $2249
$3999 $3599
$4999 $4249
$5999 $5099


*While we strive to always give you current and accurate information, the numbers depicted on the website are indicative and may differ from the actual numbers in the main report. At Expert Market Research, we aim to bring you the latest insights and trends in the market. Using our analyses and forecasts, stakeholders can understand the market dynamics, navigate challenges, and capitalize on opportunities to make data-driven strategic decisions.*
Get in touch with us for a customized solution tailored to your unique requirements and save upto 35%!
In 2025, the market reached an approximate volume of 190.72 Million Tons.
The market is projected to grow at a CAGR of 2.50% between 2026 and 2035.
The major drivers of the industry, such as rising disposable incomes, increasing population, increasing awareness of a balanced diet, rising consumption of processed foods, and growing consumption fish and seafood, are expected to aid the market growth.
The key trend guiding the growth of the market includes the use of the product across a wide variety of food products.
The major regions in the industry are North America, Latin America, the Middle East and Africa, Europe, and the Asia Pacific.
The leading fish types in the industry are tuna, salmon, and shellfish, among others.
The major application segments in the market are food products and food processing.
The significant distribution channels in the industry are B2B and B2C.
The major players in the industry are Hakka Pty Ltd, LI Chuan Food Products PTE LTD, Nishi Nihon Kibun Foods Inc., Mannarich Food Inc., and Princes Limited, among others.
The market is estimated to witness healthy growth in the forecast period of 2026-2035 to reach a volume of around 244.14 Million Tons by 2035.
Explore our key highlights of the report and gain a concise overview of key findings, trends, and actionable insights that will empower your strategic decisions.
| REPORT FEATURES | DETAILS |
| Base Year | 2025 |
| Historical Period | 2019-2025 |
| Forecast Period | 2026-2035 |
| Scope of the Report |
Historical and Forecast Trends, Industry Drivers and Constraints, Historical and Forecast Market Analysis by Segment:
|
| Breakup by Fish Type |
|
| Breakup by Application |
|
| Breakup by Distribution Channel |
|
| Breakup by Region |
|
| Market Dynamics |
|
| Competitive Landscape |
|
| Companies Covered |
|
| Report Price and Purchase Option | Explore our purchase options that are best suited to your resources and industry needs. |
| Delivery Format | Delivered as an attached PDF and Excel through email, with an option of receiving an editable PPT, according to the purchase option. |
Datasheet
One User
USD 2,499
USD 2,249
tax inclusive*
Single User License
One User
USD 3,999
USD 3,599
tax inclusive*
Five User License
Five User
USD 4,999
USD 4,249
tax inclusive*
Corporate License
Unlimited Users
USD 5,999
USD 5,099
tax inclusive*
*Please note that the prices mentioned below are starting prices for each bundle type. Kindly contact our team for further details.*
Flash Bundle
Small Business Bundle
Growth Bundle
Enterprise Bundle
*Please note that the prices mentioned below are starting prices for each bundle type. Kindly contact our team for further details.*
Flash Bundle
Number of Reports: 3
20%
tax inclusive*
Small Business Bundle
Number of Reports: 5
25%
tax inclusive*
Growth Bundle
Number of Reports: 8
30%
tax inclusive*
Enterprise Bundle
Number of Reports: 10
35%
tax inclusive*
How To Order

Select License Type
Choose the right license for your needs and access rights.

Click on ‘Buy Now’
Add the report to your cart with one click and proceed to register.

Select Mode of Payment
Choose a payment option for a secure checkout. You will be redirected accordingly.
Gain insights to stay ahead and seize opportunities.

Get insights & trends for a competitive edge.

Track prices with detailed trend reports.

Analyse trade data for supply chain insights.

Leverage cost reports for smart savings

Enhance supply chain with partnerships.

Connect For More Information
Our expert team of analysts will offer full support and resolve any queries regarding the report, before and after the purchase.
Our expert team of analysts will offer full support and resolve any queries regarding the report, before and after the purchase.
We employ meticulous research methods, blending advanced analytics and expert insights to deliver accurate, actionable industry intelligence, staying ahead of competitors.
Our skilled analysts offer unparalleled competitive advantage with detailed insights on current and emerging markets, ensuring your strategic edge.
We offer an in-depth yet simplified presentation of industry insights and analysis to meet your specific requirements effectively.


Share