

Consumer Insights
Uncover trends and behaviors shaping consumer choices today
Procurement Insights
Optimize your sourcing strategy with key market data
Industry Stats
Stay ahead with the latest trends and market analysis.

The global ferroalloys market size was approximately 51019.37 KMT in 2025. The market is estimated to grow at a CAGR of 2.10% during 2026-2035 to reach a volume of 62804.75 KMT by 2035.
Base Year
Historical Period
Forecast Period
More than 80% of ferroalloys produced are primarily deployed in the manufacture of steel.
In 2020, China produced about 36,000 thousand tons, while South Africa produced about 2,984 thousand tons of ferroalloys.
The construction sector accounts for about 50% of the total steel consumption. The global construction sector is estimated to witness a 3.9% annual growth rate by 2030.
Compound Annual Growth Rate
2.1%
Value in KMT
2026-2035
*this image is indicative*
| Global Ferroalloys Market Report Summary | Description | Value |
| Base Year | KMT | 2025 |
| Historical Period | KMT | 2019-2025 |
| Forecast Period | KMT | 2026-2035 |
| Market Size 2025 | KMT | 51019.37 |
| Market Size 2035 | KMT | 62804.75 |
| CAGR 2019-2025 | Percentage | XX% |
| CAGR 2026-2035 | Percentage | 2.10% |
| CAGR 2026-2035 - Market by Region | Latin America | 2.4% |
| CAGR 2026-2035 - Market by Country | Brazil | 2.7% |
| CAGR 2026-2035 - Market by Country | Mexico | 2.3% |
| CAGR 2026-2035 - Market by Product | Ferromanganese | 2.4% |
| CAGR 2026-2035 - Market by Application | Superalloys | 2.5% |
| Market Share by Country | USA | 4.4% |
Ferroalloys are widely used in the production of steel. The inclusion of ferroalloys improves properties such as strength, ductility, and fatigue or corrosion resistance, making it more suitable for structural applications that require high strength and wear resistance.
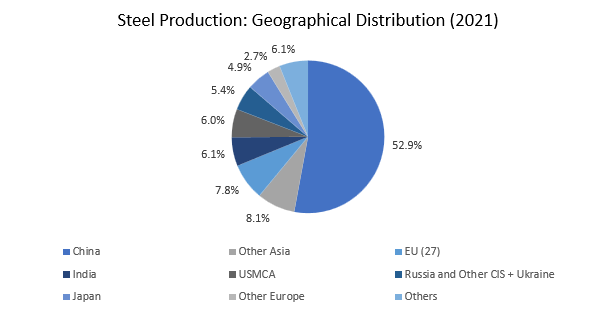
Figure: Major steel-producing countries 2021 and 2020 (MT)
Steel is a key material in the construction, automotive, and industrial machinery and equipment sectors. According to the World Steel Organisation, about 900 kg of steel is used per vehicle. In 2022, motor vehicle production constituted to about 85.4 million, marking an increase of 5.7% compared to 2021.
The growing infrastructure and construction sector contributes to the demand for steel. About 50% of the steel produced on a global scale is consumed by the building and infrastructure sector. Globally, the construction sector is anticipated to reach USD 14.4 trillion by 2030. Infrastructure development is influenced by factors such as government investments, urbanisation, and technological improvements.
| Country | 2021 | 2020 |
| China | 1,032.8 | 1,064.7 |
| India | 118.2 | 100.3 |
| Japan | 96.3 | 83.2 |
| United States | 85.8 | 72.7 |
| Russia | 75.6 | 71.6 |
| South Korea | 70.4 | 67.1 |
| Turkey | 40.4 | 35.8 |
| Germany | 40.1 | 35.7 |
| Brazil | 36.2 | 31.4 |
| Italy | 24.4 | 20.4 |
Technological advancements; growing manufacturing sector; demand from the construction industry; and expansion of the automobile sector are the major trends in the ferroalloys market
| Date | Company | Event |
| Jan 2024 | Ferro Alloys Corporation Limited | Ferro Alloys Corporation Limited (FACOR) and Metso Corporation joined hands on the design and delivery of a ferrochrome plant for FACOR’s expansion project in Bhadrak, Odisha, India. |
| Jul 2023 | Green Ferro Alloy | Sohar Port and Freezone have signed a land lease agreement with Green Ferro Alloy for Oman's first silicon metal plant, set to be established on a 160,000-sq-m area within the freezone |
| Apr 2022 | Tata Steel | Tata Steel successfully acquired ferroalloy assets of Stork Ferro and Mineral Industries Private Limited (SFML) for Rs 155 crore in an all-cash deal. |
| Trends | Impact |
| Increasing demand for steel and rapid infrastructure development | Increasing industrialisation and infrastructure development across emerging economies fuel the steel demand, which presents growth opportunities in the ferroalloys market. |
| Technological advancements | The increasing technological innovations in ferroalloy production processes contribute to efficiency and quality improvements. |
| Thriving automotive sector | The expanding automotive sector along with rising demand for machinery supports the demand for steel, and thus ferroalloys. |
| Expanding manufacturing sector | Ferroalloys such as ferronickel and ferromanganese play a crucial role in the manufacturing of low-carbon metallic, jaws of rock crushers, and high-speed reducing equipment at excessive temperatures. |
The expanding automotive industry, along with the rising demand for machinery drives the demand for steel, one of the leading consumers of ferroalloys. With the global shift towards electric vehicles, there is a rising demand for speciality alloys used in batteries and various components. Heavy machinery requirements, supported by industrialisation in developing economies, are expected to fuel the demand of steel, and, in turn, aid the ferroalloys market expansion.
Research and development efforts to discover and commercialise new ferroalloys with enhanced properties open avenues for market expansion. This involves exploring diverse alloy compositions, production techniques, and material structures to attain targeted characteristics like enhanced strength, corrosion resistance, heat resistance, and conductivity. These innovations play a crucial role in meeting the evolving demands of various sectors. The production of ferroalloys, like ferrotungsten, is reshaping the manufacturing landscape across industries such as defense, aerospace, science and medicine, electronics, automotive, construction, energy, consumer goods, and more.


“Ferroalloys Market Report and Forecast 2026-2035” offers a detailed analysis of the market based on the following segments:
Market Breakup by Process
Market Breakup by Product
Market Breakup by Application
Market Breakup by Region
| CAGR 2026-2035 - Market by | Application |
| Superalloys | 2.5% |
| Welding Electrode | 2.4% |
| Others | XX% |
| Stainless Steel | XX% |
| Carbon Steel | XX% |
Stainless steel dominates the global ferroalloys market share, supported by its heightened demand from the construction sector, among other industries
The growth of the manufacturing, automotive and infrastructural sectors are key drivers aiding the demand for steel globally. The steel sector is the largest consumer of ferroalloys to enhance their performance and characteristics. While ferrochrome provides corrosion resistance to steel, ferromanganese improves the strength profile and wear and tear resistance of steel. China is the world's largest stainless-steel producer and consumer. Its output rose by 1.64% y-o-y to over 30.6 million tons in 2021, with consumption rising 1.92 % y-o-y to about 26.1 million tons.
| Market Share by | Country |
| USA | 4% |
| Canada | XX% |
| UK | XX% |
| Germany | XX% |
Bulk ferroalloys, such as manganese, chrome, and silicon alloys, are widely consumed in the production of steel, including carbon steel. For instance, ferrochrome enhances the hardness and wear resistance of carbon steel.
Rapid industrialisation and urbanisation are leading to an increasing demand for improved infrastructural facilities, driving the demand for welding and welding electrodes. The powdered form of ferroalloys is one of the primary raw materials used in the electrode welding process as they improve the weld quality.
In the aviation sector, superalloys help in the production of robust jet engines with the capability to withstand elevated temperatures and extreme forces experienced by engine components.
Based on product, silicomanganese accounts for a significant share of the global ferroalloys market
The growing adoption of lightweight materials in the automotive sector is contributing to the increased inclusion of silicomanganese in steel.
| CAGR 2026-2035 - Market by | Product |
| Ferromanganese | 2.4% |
| Ferronickel | 2.3% |
| Ferrosilicon | XX% |
| Ferrochromium | XX% |
| Silicomanganese | XX% |
Noble ferroalloys are of high value and vital inputs to produce special steels. Prominent noble ferro alloys include, ferronickel, ferromolybdenum, ferrotungsten, ferrovanadium, ferrotitanium, ferroaluminum, ferroniobium, and ferroboron.
Meanwhile, ferrosilicon (FeSi) acts as an alloying element to produce steel and iron castings. Premium grade ferrosilicon is consumed for electrical steels that are demanded by the electric vehicle and renewable energy sectors.
The market players are optimising production capacity, economies-of-scale, access to raw materials, and customer services, among others, leveraging advanced technologies and strategic partnerships
| Company | Founded | Headquarters | Services |
| Tata Steel Limited | 1907 | India | Provides ferroalloys under three brands which are Tata Tiscrome, Tata Silcomag, and Tata Ferromag and several other products. |
| AMG Vanadium LLC | 1952 | United States | Specialises in providing ferroalloys such as ferronickel-molybdenum alloy, and low-aluminium ferrovanadium. |
| Metraco NV | 1993 | Belgium | Provides ferroalloys such as ferromolybdenum, ferrovanadium, ferrotitanium, ferronobium, ferroboron, ferrotungsten, etc. |
| DS Alloyd Pvt. Ltd. | 1994 | India | Provides ferroalloys such as ferro manganese low carbon, ferro vanadium, ferro molybdenum, ferro niobium, ferro silicon, and ferro alloy powder |
Other notable players operating in the global ferroalloys market include LekonGermess Ltd., Glencore Plc., Ferro Alloys Corporation Limited, and Essel Mining & Industries Limited, among others. Manufacturers are upgrading their production capacities and incorporating the latest capabilities to meet the increasing consumer demand.
The Asia Pacific is the largest market for ferro alloys globally, representing more than half of the global demand. Further, China is the largest market in APAC, contributing to 71.5% of the demand in 2023. China is the world's largest consumer and producer of crude steel as well as the largest ferroalloys producer and consumer.
| CAGR 2026-2035 - Market by | Region |
| Latin America | 2.4% |
| Asia Pacific | 2.2% |
| North America | XX% |
| Europe | XX% |
| Middle East and Africa | XX% |
China is one of the key countries engaged in ferroalloy production. The top ten ferro-alloy-producing provinces in China include Inner Mongolia, Ningxia, Guangxi, Shaanxi, Qinghai, Hunan, Guizhou, Shanxi, Shandong, and Gansu. As per the China Ferroalloy Industry Association, in the first four months of 2023, China produced 1.168 million tons of ferroalloy products, with the top ten provinces producing 85.55% of the total.
In Europe, the presence of efficient production processes, specific know-how, and high standards support the ferroalloys market growth. In 2020, ferrochromium production in Russia constituted 390,000 tons, ferromanganese - 240,000 tons, ferrosilicon – 830,000 tons, and ferromolybdenum - 4,700 tons.
| CAGR 2026-2035 - Market by | Country |
| Brazil | 2.7% |
| India | 2.5% |
| Mexico | 2.3% |
| China | 2.1% |
| Australia | 1.5% |
| USA | XX% |
| Canada | XX% |
| UK | XX% |
| Germany | XX% |
| France | XX% |
| Italy | XX% |
| Japan | 1.3% |
| Saudi Arabia | XX% |
The Middle East construction sector is dominated by the KSA and UAE with a total pipeline of USD 1.36 billion of projects (currently under development). The infrastructure sector in the region is transforming as a result of several government initiatives.
High Performance Alloys Market
Non-Magnetic Metals and Alloys Market
Metal Implants and Medical Alloys Market


Upto 15% Off
USD
$2499 $2249
$3999 $3599
$4999 $4249
$5999 $5099


*While we strive to always give you current and accurate information, the numbers depicted on the website are indicative and may differ from the actual numbers in the main report. At Expert Market Research, we aim to bring you the latest insights and trends in the market. Using our analyses and forecasts, stakeholders can understand the market dynamics, navigate challenges, and capitalize on opportunities to make data-driven strategic decisions.*
Get in touch with us for a customized solution tailored to your unique requirements and save upto 35%!
The market attained a volume of 51019.37 KMT in 2025.
The market is estimated to grow at a CAGR of 2.10% during 2026-2035.
The market is estimated to witness a healthy growth in the forecast period of 2026-2035 to reach a volume of 62804.75 KMT by 2035.
The major drivers of the market include the availability of iron ore in abundance and the various advantages offered by ferroalloys.
The expansion of the construction sector, increasing demand for steel, and the growing demand from end-use sectors are the key trends propelling the growth of the market.
The key regional markets for ferroalloys are North America, Europe, the Asia Pacific, Latin America, and the Middle East and Africa.
The key applications of the product are stainless steel, carbon steel, welding electrode, superalloys, others.
The key players in the market include Tata Steel Limited, AMG Vanadium LLC, Metraco NV, DS Alloyd Pvt. Ltd., LekonGermess Ltd., Glencore Plc., Ferro Alloys Corporation Limited, and Essel Mining & Industries Limited, among others.
Explore our key highlights of the report and gain a concise overview of key findings, trends, and actionable insights that will empower your strategic decisions.
| REPORT FEATURES | DETAILS |
| Base Year | 2025 |
| Historical Period | 2019-2025 |
| Forecast Period | 2026-2035 |
| Scope of the Report |
Historical and Forecast Trends, Industry Drivers and Constraints, Historical and Forecast Market Analysis by Segment:
|
| Breakup by Process |
|
| Breakup by Product |
|
| Breakup by Application |
|
| Breakup by Region |
|
| Market Dynamics |
|
| Competitive Landscape |
|
| Companies Covered |
|
| Report Price and Purchase Option | Explore our purchase options that are best suited to your resources and industry needs. |
| Delivery Format | Delivered as an attached PDF and Excel through email, with an option of receiving an editable PPT, according to the purchase option. |
Datasheet
One User
USD 2,499
USD 2,249
tax inclusive*
Single User License
One User
USD 3,999
USD 3,599
tax inclusive*
Five User License
Five User
USD 4,999
USD 4,249
tax inclusive*
Corporate License
Unlimited Users
USD 5,999
USD 5,099
tax inclusive*
*Please note that the prices mentioned below are starting prices for each bundle type. Kindly contact our team for further details.*
Flash Bundle
Small Business Bundle
Growth Bundle
Enterprise Bundle
*Please note that the prices mentioned below are starting prices for each bundle type. Kindly contact our team for further details.*
Flash Bundle
Number of Reports: 3
20%
tax inclusive*
Small Business Bundle
Number of Reports: 5
25%
tax inclusive*
Growth Bundle
Number of Reports: 8
30%
tax inclusive*
Enterprise Bundle
Number of Reports: 10
35%
tax inclusive*
How To Order

Select License Type
Choose the right license for your needs and access rights.

Click on ‘Buy Now’
Add the report to your cart with one click and proceed to register.

Select Mode of Payment
Choose a payment option for a secure checkout. You will be redirected accordingly.
Gain insights to stay ahead and seize opportunities.

Get insights & trends for a competitive edge.

Track prices with detailed trend reports.

Analyse trade data for supply chain insights.

Leverage cost reports for smart savings

Enhance supply chain with partnerships.

Connect For More Information
Our expert team of analysts will offer full support and resolve any queries regarding the report, before and after the purchase.
Our expert team of analysts will offer full support and resolve any queries regarding the report, before and after the purchase.
We employ meticulous research methods, blending advanced analytics and expert insights to deliver accurate, actionable industry intelligence, staying ahead of competitors.
Our skilled analysts offer unparalleled competitive advantage with detailed insights on current and emerging markets, ensuring your strategic edge.
We offer an in-depth yet simplified presentation of industry insights and analysis to meet your specific requirements effectively.


Share