

Consumer Insights
Uncover trends and behaviors shaping consumer choices today
Procurement Insights
Optimize your sourcing strategy with key market data
Industry Stats
Stay ahead with the latest trends and market analysis.
Trending Now


The global feed testing market is estimated to be around USD 2.30 Billion in 2024. The market is expected to witness further growth in the forecast period of 2025-2034 and is expected to grow at an estimated CAGR of 6.50%, to reach a value of USD 4.32 Billion in 2034.
Base Year
Historical Year
Forecast Year


Value in USD Billion
2025-2034
Feed Testing Market Outlook
*this image is indicative*
| Global Feed Testing Market Report Summary | Description | Value |
| Base Year | USD Billion | 2024 |
| Historical Period | USD Billion | 2018-2024 |
| Forecast Period | USD Billion | 2025-2034 |
| Market Size 2024 | USD Billion | 2.30 |
| Market Size 2034 | USD Billion | 4.32 |
| CAGR 2018-2024 | Percentage | XX% |
| CAGR 2025-2034 | Percentage | 6.50% |
| CAGR 2025-2034 - Market by Region | Asia Pacific | 7.5% |
| CAGR 2025-2034 - Market by Country | India | 8.1% |
| CAGR 2025-2034 - Market by Country | China | 7.2% |
| CAGR 2025-2034 - Market by Technology | Rapid Technology | 7.3% |
| CAGR 2025-2034 - Market by Feed Stock | Pet Feed | 7.6% |
| Market Share by Country 2024 | France | 3.5% |
Read more about this report - REQUEST FREE SAMPLE COPY IN PDF
The rapidly growing meat and poultry industries are aiding the growth of the feed industry, which is supporting the growth of the feed testing market. The market is being aided by the rapid growth of the meat market, especially in the emerging regions of the Asia Pacific.


As the meat processing industry is becoming more commercialised and mechanised, there is a greater risk of feed contamination. The growing commercialisation of the meat industry is also leading to the risk of overcrowding, which can also lead to contamination.
| 2024 Market Share by | Country |
| France | 3.5% |
| USA | XX% |
| Canada | XX% |
| UK | XX% |
With governments implementing strict regulations and fines against feed contamination, companies are seeking to update their feed safety criteria to meet the regulatory requirements. With companies and governments undertaking greater feed testing regularly, the feed testing demand is expected to witness upward trajectory in the coming years. The rising awareness among consumers regarding the safety and hygiene of food products is also aiding the industry growth. The rise in innovation in testing technology is also expected to drive the industry growth in the coming years.
| CAGR 2025-2034 - Market by | Feed Stock |
| Pet Feed | 7.6% |
| Poultry Feed | 7.1% |
| Swine Feed | 6.8% |
| Cattle Feed | XX% |
| Aquafeed | XX% |
| Others | XX% |
| CAGR 2025-2034 - Market by | Country |
| India | 8.1% |
| China | 7.2% |
| Mexico | 6.5% |
| USA | 5.8% |
| France | 5.1% |
| Canada | XX% |
| UK | XX% |
| Germany | XX% |
| Italy | 4.6% |
| Japan | XX% |
| Australia | XX% |
| Saudi Arabia | XX% |
| Brazil | XX% |
As per the feed testing market dynamics and trends, in Feb 2024, the Indian government announced the opening of a new microbiology laboratory for food testing and 17 Food Safety on Wheels (FSW) vehicles in the state of Assam. This food laboratory is set up by the Food Safety Standards Authority of India (FSSAI) to enhance the food testing infrastructure.
The largest increase in feed production was seen in the Asia-Pacific region, growing from 433.610 million metric tons in 2020 to 458.121 million metric tons in 2021, marking a growth of 5.7%. According to the feed testing industry analysis, Europe experienced a decline in feed production, dropping from 270.205 million metric tons in 2020 to 266.840 million metric tons in 2021, a decrease of 1.2%. North America saw an increase in feed production, from 248.123 million metric tons in 2020 to 252.928 million metric tons in 2021, which is a growth of 1.9%.
Feed production in Latin America slightly increased from 177.572 million metric tons in 2020 to 178.382 million metric tons in 2021, a modest growth of 0.5%. Africa showed a 2.4% growth in feed production, from 43.201 million metric tons in 2020 to 44.221 million metric tons in 2021, which supported the growth of the feed testing industry. Middle East experienced a decrease in feed production, from 24.791 million metric tons in 2020 to 24.592 million metric tons in 2021, a decline of 0.8%. Feed production in Oceania saw a slight growth, from 10.359 million metric tons in 2020 to 10.433 million metric tons in 2021, an increase of 0.7%. Overall, global feed production increased from 1,207.861 million metric tons in 2020 to 1,235.517 million metric tons in 2021, reflecting a total growth of 2.3%. This indicates varying regional dynamics in feed production with significant growth in the Asia-Pacific and Africa, stability in North America and Oceania, and declines in Europe and the Middle East.
According to USDA, Mexico is listed as the largest market with a total export value of USD 7.66 billion of grains, feeds, and fodders export, followed by China with USD 4.19 billion, and Japan with USD 3.81 billion, which contributes to the feed testing industry revenue. Canada and Colombia are also significant markets, having export values of USD 1.7 billion and USD 1.45 billion, respectively. South Korea rounds out the list with exports worth USD 1.12 billion.
Read more about this report - REQUEST FREE SAMPLE COPY IN PDF
Feed testing is the evaluation of feed quality for its suitability for consumption by animals. It tests for contaminants like fungi, bacteria, and viruses, along with the presence of harmful hormones and chemicals. It tests livestock feed like poultry, swine, pet, cattle, and aquafeed, among others.
Market Breakup by Testing Method:
Market Breakup by Technology:
Market Breakup by Feed Stock:
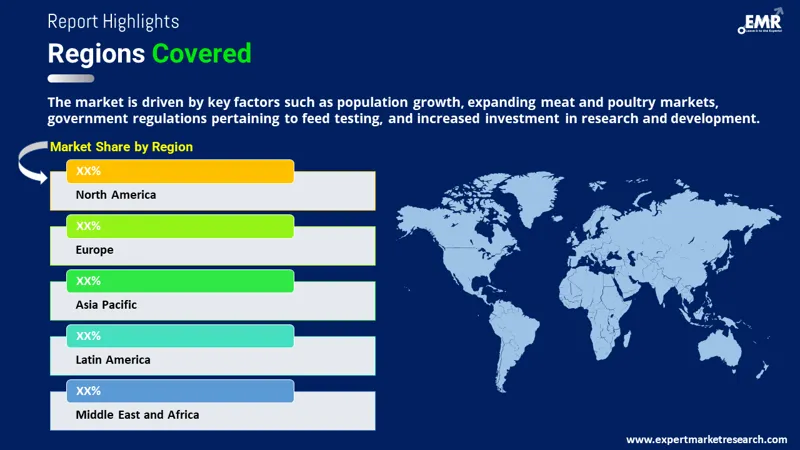
Market Breakup by Region:
| CAGR 2025-2034 - Market by | Technology |
| Rapid Technology | 7.3% |
| Traditional Technology | XX% |
| CAGR 2025-2034 - Market by | Region |
| Asia Pacific | 7.5% |
| North America | 5.9% |
| Europe | XX% |
| Latin America | XX% |
| Middle East and Africa | XX% |
May 2018- Eurofins Scientific announced the opening of its Suzhou, China-based food testing laboratory, which provides compliance testing for feed and food samples according to the regulations of China, Japan, the United States of America, and the European Union (EU).
The report analyses the following key players in the global feed safety testing market, covering their capacities, market share, and latest developments like capacity expansions, plant turnarounds, and mergers, acquisitions, and investments:
The comprehensive report by EMR looks into the macro and micro aspects of the industry. The report also assesses the market based on Porter’s Five Forces model as well as providing a SWOT analysis of the market.
Read more about this report - REQUEST FREE SAMPLE COPY IN PDF
North America and Europe, which have extensive feed testing regulations and accreditations, are the major regional markets in the region. Regulations have been put in place in these regions due to the rising cases of animal feed being compromised with harmful chemicals, hormones, pathogens, and other contaminants, which impacts the feed testing market expansion. In the early 2000s, Europe was plagued with the infiltration of hormone-tainted feed in countries like Germany, Belgium, and the Netherlands as feed was found contaminated with medroxyprogesterone acetate (MPA), a hormone which causes infertility in animals and humans. Cancer-causing herbicide nitrofen was also detected in the organic farms of Germany during the same period. Such incidents have led to stricter implementation of feed testing by companies and governments in the area, thus, promoting the growth of the feed testing industry.
In the US, the Food Safety Modernization Act (FSMA) was introduced in 2011 to prevent rather than react to the problems of human and animal food contamination, which is a crucial trend in feed testing market. The quality of animal feed is also being controlled according to the Animal Feed Regulatory Program Standards (AFRPS) by FDA, which were last updated in 2017. These regulations are encouraging the growth of the feed testing industry. The industry is also expected to witness a healthy growth in the Asia Pacific as the region is witnessing a rising consumption of poultry and pork in countries like China and India, leading to a rising need for feed testing.
Mycotoxins are one of the most common substances, which are tested for in the animal feed. It contaminates a wide range of crops and fruits and is the secondary metabolite of mould. It is toxic to humans and animals. With the cereals, which are used for feed applications, being susceptible to fungi formation, there are multiple regulations regarding the presence of mycotoxins in feed. Currently, over 100 countries have regulations pertaining to mycotoxins in food and feed, thus, supporting the feed testing industry development in this segment.
*While we strive to always give you current and accurate information, the numbers depicted on the website are indicative and may differ from the actual numbers in the main report. At Expert Market Research, we aim to bring you the latest insights and trends in the market. Using our analyses and forecasts, stakeholders can understand the market dynamics, navigate challenges, and capitalize on opportunities to make data-driven strategic decisions.*
Get in touch with us for a customized solution tailored to your unique requirements and save upto 35%!
In 2024, the market attained a value of approximately USD 2.30 Billion.
The market is projected to grow at a CAGR of 6.50% between 2025 and 2034.
The major drivers of the market include growing population, rising demand for meat and poultry, increasing research and development investment, and regulations of various governments for feed testing.
Growing customer awareness for safety and hygiene of food and the rising technological innovations are the key trends propelling the growth of the market.
The major regions in the market are North America, Latin America, the Middle East and Africa, Europe, and the Asia Pacific, with North America and Europe accounting for the largest share in the market.
Traditional technology and rapid technology are the major technologies in the global feed testing market.
Chemical testing, physical testing, nutritional testing, microbiological testing, and pathogen testing, among others are the different testing methods in the market.
The different feed stock in the market include poultry feed, swine feed, pet feed, cattle feed, and aquafeed, among others.
The major players in the market are SGS Group., R J Hill Laboratories Limited., Eurofins Scientific, Intertek Group plc, Romer Labs Division Holding GmbH, and NSF International, among others.
The market is estimated to reach a value of about USD 4.32 Billion by 2034.
Explore our key highlights of the report and gain a concise overview of key findings, trends, and actionable insights that will empower your strategic decisions.
| REPORT FEATURES | DETAILS |
| Base Year | 2024 |
| Historical Period | 2018-2024 |
| Forecast Period | 2025-2034 |
| Scope of the Report |
Historical and Forecast Trends, Industry Drivers and Constraints, Historical and Forecast Market Analysis by Segment:
|
| Breakup by Testing Method |
|
| Breakup by Technology |
|
| Breakup by Feed Stock |
|
| Breakup by Region |
|
| Market Dynamics |
|
| Competitive Landscape |
|
| Companies Covered |
|
| Report Price and Purchase Option | Explore our purchase options that are best suited to your resources and industry needs. |
| Delivery Format | Delivered as an attached PDF and Excel through email, with an option of receiving an editable PPT, according to the purchase option. |
Datasheet
One User
USD 2,499
USD 2,249
tax inclusive*
Single User License
One User
USD 3,999
USD 3,599
tax inclusive*
Five User License
Five User
USD 4,999
USD 4,249
tax inclusive*
Corporate License
Unlimited Users
USD 5,999
USD 5,099
tax inclusive*
*Please note that the prices mentioned below are starting prices for each bundle type. Kindly contact our team for further details.*
Flash Bundle
Small Business Bundle
Growth Bundle
Enterprise Bundle
*Please note that the prices mentioned below are starting prices for each bundle type. Kindly contact our team for further details.*
Flash Bundle
Number of Reports: 3
20%
tax inclusive*
Small Business Bundle
Number of Reports: 5
25%
tax inclusive*
Growth Bundle
Number of Reports: 8
30%
tax inclusive*
Enterprise Bundle
Number of Reports: 10
35%
tax inclusive*
How To Order
Our step-by-step guide will help you select, purchase, and access your reports swiftly, ensuring you get the information that drives your decisions, right when you need it.

Select License Type
Choose the right license for your needs and access rights.

Click on ‘Buy Now’
Add the report to your cart with one click and proceed to register.

Select Mode of Payment
Choose a payment option for a secure checkout. You will be redirected accordingly.
Track prices with detailed trend reports.

Analyse trade data for supply chain insights.

Leverage cost reports for smart savings

Enhance supply chain with partnerships.

Gain insights to stay ahead and seize opportunities.

Get insights & trends for a competitive edge.

Track prices with detailed trend reports.
Analyse trade data for supply chain insights.
Leverage cost reports for smart savings
Enhance supply chain with partnerships.
Gain insights to stay ahead and seize opportunities.
Get insights & trends for a competitive edge.
Track prices with detailed trend reports.
Analyse trade data for supply chain insights.
Connect For More Information
Our expert team of analysts will offer full support and resolve any queries regarding the report, before and after the purchase.
Our expert team of analysts will offer full support and resolve any queries regarding the report, before and after the purchase.
We employ meticulous research methods, blending advanced analytics and expert insights to deliver accurate, actionable industry intelligence, staying ahead of competitors.
Our skilled analysts offer unparalleled competitive advantage with detailed insights on current and emerging markets, ensuring your strategic edge.
We offer an in-depth yet simplified presentation of industry insights and analysis to meet your specific requirements effectively.
Australia
63 Fiona Drive, Tamworth, NSW
+61-448-061-727
India
C130 Sector 2 Noida, Uttar Pradesh 201301
+91-723-689-1189
Philippines
40th Floor, PBCom Tower, 6795 Ayala Avenue Cor V.A Rufino St. Makati City,1226.
+63-287-899-028, +63-967-048-3306
United Kingdom
6 Gardner Place, Becketts Close, Feltham TW14 0BX, Greater London
+44-753-713-2163
United States
30 North Gould Street, Sheridan, WY 82801
+1-415-325-5166
Vietnam
193/26/4 St.no.6, Ward Binh Hung Hoa, Binh Tan District, Ho Chi Minh City
+84-865-399-124
United States (Head Office)
30 North Gould Street, Sheridan, WY 82801
+1-415-325-5166
Australia
63 Fiona Drive, Tamworth, NSW
+61-448-061-727
India
C130 Sector 2 Noida, Uttar Pradesh 201301
+91-723-689-1189
Philippines
40th Floor, PBCom Tower, 6795 Ayala Avenue Cor V.A Rufino St. Makati City, 1226.
+63-287-899-028, +63-967-048-3306
United Kingdom
6 Gardner Place, Becketts Close, Feltham TW14 0BX, Greater London
+44-753-713-2163
Vietnam
193/26/4 St.no.6, Ward Binh Hung Hoa, Binh Tan District, Ho Chi Minh City
+84-865-399-124


Share