

Consumer Insights
Uncover trends and behaviors shaping consumer choices today
Procurement Insights
Optimize your sourcing strategy with key market data
Industry Stats
Stay ahead with the latest trends and market analysis.

The size of global feed additives market was around USD 76.87 Billion in 2025. The market is further expected to grow at a CAGR of 5.30% over the forecast period of 2026-2035 to attain a value of USD 128.84 Billion by 2035.
Base Year
Historical Period
Forecast Period
China, the United States, and Brazil are the top three feed-producing countries.
In 2019, the total livestock population in India was 535.78 million, showing an increase of 4.6% over the 2012 Livestock Census. This includes population of cattle, buffalo, sheep, and goat, among others.
As per industry reports, feed production increased by 1.6%, 0.88%, and 0.32% in Latin America, North America, and Oceania in 2022.
Compound Annual Growth Rate
5.3%
Value in USD Billion
2026-2035
*this image is indicative*
| Global Feed Additives Market Report Summary | Description | Value |
| Base Year | USD Billion | 2025 |
| Historical Period | USD Billion | 2019-2025 |
| Forecast Period | USD Billion | 2026-2035 |
| Market Size 2025 | USD Billion | 76.87 |
| Market Size 2035 | USD Billion | 128.84 |
| CAGR 2019-2025 | Percentage | XX% |
| CAGR 2026-2035 | Percentage | 5.30% |
| CAGR 2026-2035 - Market by Region | Asia Pacific | 6.1% |
| CAGR 2026-2035 - Market by Country | India | 7.0% |
| CAGR 2026-2035 - Market by Country | China | 5.9% |
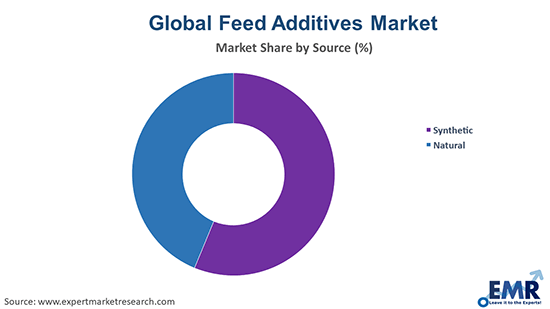
| CAGR 2026-2035 - Market by Source | Natural | 6.7% |
| CAGR 2026-2035 - Market by Livestock | Poultry | 6.0% |
| Market Share by Country 2025 | India | 3.6% |
Feed additives refer the substance that is used in animal nutrition for the purpose of enhancing the quality of feed, aiming to improve the animals' performance and health, and thus, the quality of food and various end-products from animal origin like, eggs, meat, and milk. This is why feed additives are carefully manufactured with the help of nutritional additives, like vitamins and minerals.
A key factor shaping feed additives market is the rising demand for animal-based food products and rising prevalence of animal diseases. Due to this, additives made from probiotics are widely being used in the livestock sector and by meat producers to proactively improve animal health and enhance disease resistance. Feed additives play a vital role in improving the health profile of animals, and with increased uncertainties regarding the nutrition of generic animal feeds, there is greater importance on feed additives specific to the animal’s nutritional needs.


Rising demand for natural feed additives, focus on animal’s gut health, and shift towards protein-rich diet are factors boosting the feed additives market growth.
Additives derived from natural sources, such as plant-based and herbal products are experiencing rise in demand due to consumer preferences for clean labels. For example, Phytogenic feed additives, which are derived from plants and herbs, are gaining popularity as an efficient alternative to antibiotics.
The importance of gut health has become a trend in the feed additives market as there is an interrelationship between gut health, animal well-being, and overall productivity. Probiotics additives are being used to maintain a healthy microbial balance in the digestive tract of poultry animals, which also reduces the risk of diseases.
The use of antibiotics in livestock is being phased out due to concerns about antibiotic resistance. As a result, there is a growing demand for antibiotic alternatives, such as phytogenic feed additives. Microencapsulation technology is also being used to improve the stability and efficacy of these additives.
The integration of digital technologies, sensors, and data analytics in precision livestock farming is transforming the formulation of feed additives. This trend enables farmers to monitor animal health and nutritional requirements in real-time and accordingly optimise productivity.
The growing consumer knowledge regarding the benefits of feed additives coupled with the outbreak of viruses and diseases is generating the need for additives in poultry, aqua, and other animal-based sectors, which in turn, is boosting the product demand worldwide. The growing consumer inclination towards protein-rich diets has also led to an increased demand for meat, dairy products, seafood, and chicken. This is further fuelling the feed additives market expansion.
With the increase in consumption of dairy products, cattle farming is also witnessing a significant rise as it one of the primary sources of dairy products. This is likely to increase the market share over the forecast period because for ensuring an efficient yield of milk and cheese products, proper bovine nutrition is necessary.
The EMR’s report titled “Feed Additives Market Report and Forecast 2025-2034” offers a detailed analysis of the market based on the following segments:
Market Breakup by Source
Market Breakup by Product Type
Market Breakup by Livestock
Market Breakup by Form
Market Breakup by Region
Various types of feed additives are gaining popularity in the market due to the growing focus on improving animal health
Among types of additives, amino acids accounts for a significant share of the market as they are essential for protein synthesis and are used extensively in poultry and swine production. Vitamins are another important segment, providing essential nutrients for animal health and growth. Acidifiers, such as phosphoric acid, are used to improve feed performance and reduce the uptake of pathogenic organisms. Carotenoids, like beta-carotene, are used to enhance the nutritional value of animal feed and improve animal health. Enzymes, such as amylase and protease, aid in the digestion and absorption of nutrients.
Mycotoxin detoxifiers help remove harmful toxins from feed, ensuring animal well-being. Minerals, including macro minerals like calcium and phosphorus, are essential for bone health and antioxidants, such as vitamin E, help protect animals from oxidative stress. Probiotics are used to improve gut health and enhance the immune system of animals. Each of these segments contributes to the overall growth and feed additives market development.
Poultry segment dominates the market due to growing demand for eggs and a rising population of broilers
The poultry segment holds the largest share of the market due to the growing demand for micro-nutrients in poultry production, consumers’ preference for poultry meat and eggs, low production and product cost of poultry meat, and high production of compound feed for poultry. Additionally, poultry are susceptible to various diseases, such as avian flu and coccidiosis, which can significantly impact production efficiency and profitability. As a result, there is a heightened need for feed additives that enhance poultry health, immunity, and overall performance.
The ruminant’s segment is expected to account for a significant feed additives market share due to the growing demand for high-quality feed and the need for efficient nutrient in ruminant production. Ruminants are known for their ability to digest and extract nutrients from plant-based feed, but they still require additional nutrients to maintain optimal health and performance. This is where feed additives help. The aquatic animal segment is also growing due to the rising consumption of fish and fish-based products and the growing demand for high-quality aqua feed.
Market players are focused on key strategies such as mergers, product launches, and partnerships to strengthen their market presence and maintain their goodwill in the competitive market.
Cargill, Incorporated was founded in 1865 and is headquartered in Minnesota, United States. The company is a leading player in the agricultural and food industries and provides agricultural commodities, animal feed, biofuels, and food ingredients. It also deals in grain trading, animal nutrition, food processing, and biofuels production.
Archer Daniels Midland Company (ADM) was founded in 1902 and is headquartered in Illinois, United States. ADM is a multinational agricultural processing and commodities trading company that offers a diverse portfolio of products including agricultural processing, biofuels, corn, soybeans, wheat, food ingredients, animal feed, and industrial products.
Evonik Industries AG, founded in 2007 as a spin-off from RAG AG, is headquartered in Essen, Germany. The company is a leading global speciality chemicals and performance materials provider, offering a diverse range of products for various industries including agriculture, animal nutrition, and pharmaceuticals.
BASF SE was founded in 1865 and is headquartered in Ludwigshafen, Germany. It is the largest chemical producer in the world and operates globally through subsidiaries and joint ventures in over 80 countries. The company’s product portfolio includes a range of chemicals, plastics, and crop protection products.
*Please note that this is only a partial list; the complete list of key players is available in the full report. Additionally, the list of key players can be customized to better suit your needs.*
Other key players in the global feed additives market include DSM, Biovet S.A., Chr. Hansen Holding A/S, Novozymes Group, Kemin Industries, Inc., Nutreco N.V., and International Flavors & Fragrances Inc., among others.
Read more about this report - REQUEST FREE SAMPLE COPY IN PDF
| CAGR 2026-2035 - Market by | Country |
| India | 7.0% |
| China | 5.9% |
| Canada | 5.1% |
| Germany | 4.4% |
| Australia | 4.2% |
| USA | XX% |
| UK | XX% |
| France | XX% |
| Italy | 3.7% |
| Japan | XX% |
| Saudi Arabia | XX% |
| Brazil | XX% |
| Mexico | XX% |
North America and Asia Pacific are prominent markets due to the rising demand for high-quality meat and seafood
The market share in North America is growing due to the increasing awareness about the benefits of additives for animal feed, the increase in outbreaks of diseases, and the increasing focus on animal productivity. The rising demand for high-quality seafood is also driving the demand for aquaculture feed and feed millers in the region are increasing production levels to meet this growing demand. Also, in September 2017, Cargill Inc. acquired the animal feed additive division of Southern States Cooperative, which boost sales of North American feed additives.
The Asia Pacific region also has a significant share in the feed additives market report driven by the growing demand for meat and dairy products by the region's burgeoning population. Countries like China and India are emerging as major players in the livestock industry, with a growing awareness of the importance of animal health and nutrition. This has fueled the demand for feed additives, particularly in the poultry and swine segments. The Asia Pacific market is further expected to grow at a high CAGR due to the increasing adoption of modern farming practices and the expanding aquaculture sector in countries like Indonesia and Vietnam.


Upto 15% Off
USD
$2999 $2699
$4399 $3959
$5599 $4759
$6659 $5660


*While we strive to always give you current and accurate information, the numbers depicted on the website are indicative and may differ from the actual numbers in the main report. At Expert Market Research, we aim to bring you the latest insights and trends in the market. Using our analyses and forecasts, stakeholders can understand the market dynamics, navigate challenges, and capitalize on opportunities to make data-driven strategic decisions.*
Get in touch with us for a customized solution tailored to your unique requirements and save upto 35%!
The global feed additives market reached a value of USD 76.87 Billion in 2025.
The market is expected to grow at a CAGR of 5.30% between 2026 and 2035.
The market is estimated to reach a value of about USD 128.84 Billion by 2035.
The major drivers of the market include rising disposable incomes, increasing population, and rising consciousness regarding health and wellness of animals.
Key trends aiding market expansion include the rising consumer knowledge about the benefits of these additives, outbreak of various diseases, demand for natural feed additives, focus on animal’s gut health, and shift towards protein-rich diet.
Regions considered in the market are North America, Europe, the Asia Pacific, Latin America, and the Middle East and Africa.
The major sources of feed additives include synthetic and natural.
The leading forms of the product in the market are dry and liquid.
Based on livestock, the market is divided into ruminants, poultry, swine, and aquatic animal, among others.
Key players in the market are Cargill, Incorporated, Archer Daniels Midland Company, Evonik Industries AG, BASF SE, DSM, Biovet S.A., Chr. Hansen Holding A/S, Novozymes Group, Kemin Industries, Inc., Nutreco N.V., and International Flavors & Fragrances Inc., among others.
Explore our key highlights of the report and gain a concise overview of key findings, trends, and actionable insights that will empower your strategic decisions.
| REPORT FEATURES | DETAILS |
| Base Year | 2025 |
| Historical Period | 2019-2025 |
| Forecast Period | 2026-2035 |
| Scope of the Report |
Historical and Forecast Trends, Industry Drivers and Constraints, Historical and Forecast Market Analysis by Segment:
|
| Breakup by Source |
|
| Breakup by Product Type |
|
| Breakup by Livestock |
|
| Breakup by Form |
|
| Breakup by Region |
|
| Market Dynamics |
|
| Competitive Landscape |
|
| Companies Covered |
|
Datasheet
One User
USD 2,999
USD 2,699
tax inclusive*
Single User License
One User
USD 4,399
USD 3,959
tax inclusive*
Five User License
Five User
USD 5,599
USD 4,759
tax inclusive*
Corporate License
Unlimited Users
USD 6,659
USD 5,660
tax inclusive*
*Please note that the prices mentioned below are starting prices for each bundle type. Kindly contact our team for further details.*
Flash Bundle
Small Business Bundle
Growth Bundle
Enterprise Bundle
*Please note that the prices mentioned below are starting prices for each bundle type. Kindly contact our team for further details.*
Flash Bundle
Number of Reports: 3
20%
tax inclusive*
Small Business Bundle
Number of Reports: 5
25%
tax inclusive*
Growth Bundle
Number of Reports: 8
30%
tax inclusive*
Enterprise Bundle
Number of Reports: 10
35%
tax inclusive*
How To Order

Select License Type
Choose the right license for your needs and access rights.

Click on ‘Buy Now’
Add the report to your cart with one click and proceed to register.

Select Mode of Payment
Choose a payment option for a secure checkout. You will be redirected accordingly.
Gain insights to stay ahead and seize opportunities.

Get insights & trends for a competitive edge.

Track prices with detailed trend reports.

Analyse trade data for supply chain insights.

Leverage cost reports for smart savings

Enhance supply chain with partnerships.

Connect For More Information
Our expert team of analysts will offer full support and resolve any queries regarding the report, before and after the purchase.
Our expert team of analysts will offer full support and resolve any queries regarding the report, before and after the purchase.
We employ meticulous research methods, blending advanced analytics and expert insights to deliver accurate, actionable industry intelligence, staying ahead of competitors.
Our skilled analysts offer unparalleled competitive advantage with detailed insights on current and emerging markets, ensuring your strategic edge.
We offer an in-depth yet simplified presentation of industry insights and analysis to meet your specific requirements effectively.


Share