

Consumer Insights
Uncover trends and behaviors shaping consumer choices today
Procurement Insights
Optimize your sourcing strategy with key market data
Industry Stats
Stay ahead with the latest trends and market analysis.

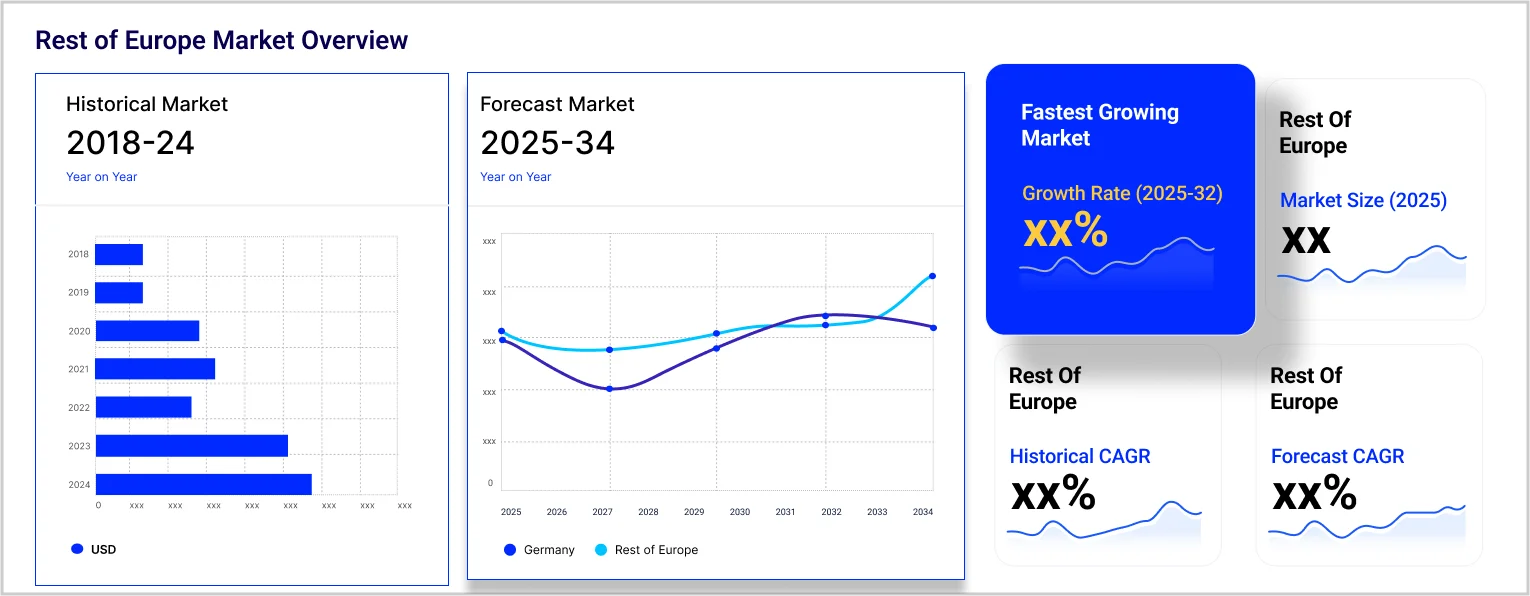
The Europe tablet market reached around 36.24 Million Units in 2025. The market is projected to grow at a CAGR of 2.40% between 2026 and 2035 to reach nearly 45.94 Million Units by 2035.
Base Year
Historical Period
Forecast Period
As per the European Statistical Agency, in 2022, 26% of individuals aged 16 to 74 within the European Union (EU) engaged in at least one online course or utilised online training resources.
The percentage of online shoppers rose from 55% in 2012 to 75% in 2022, reflecting an increase of 20 percentage points (pp).
According to the statistics from the European Union, 72% of internet users in the region now obtain their news through online platforms.
Compound Annual Growth Rate
2.4%
Value in Million Units
2026-2035
*this image is indicative*
| Europe Tablet Market Report Summary | Description | Value |
| Base Year | Million Units | 2025 |
| Historical Period | Million Units | 2019-2025 |
| Forecast Period | Million Units | 2026-2035 |
| Market Size 2025 | Million Units | 36.24 |
| Market Size 2035 | Million Units | 45.94 |
| CAGR 2019-2025 | Percentage | XX% |
| CAGR 2026-2035 | Percentage | 2.40% |
| CAGR 2026-2035 - Market by Country | United Kingdom | 2.6% |
| CAGR 2026-2035 - Market by Country | Italy | 2.2% |
| CAGR 2026-2035 - Market by Operating System | Android | 3.5% |
| CAGR 2026-2035 - Market by Screen Size | 8 Inch and Above | 3.7% |
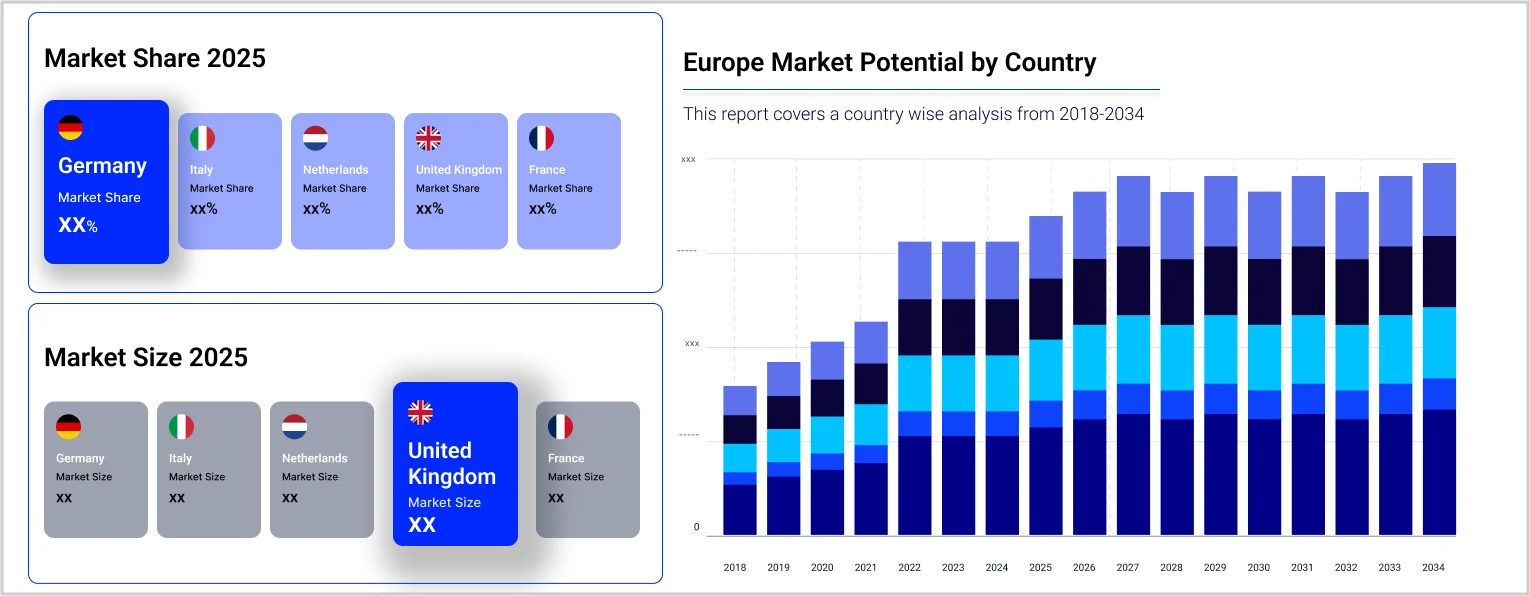
| 2025 Market Share by Country | Italy | 9.2% |
Overall, participation in online education saw an increase in 2023 compared to the previous year. The highest levels of interest in online education were recorded in Finland (50%), Spain (42%), and both Sweden and the Netherlands (40%). The demand for tablets has significantly surged, largely due to the growing trend towards online learning. This shift has been propelled by various factors, including advancements in technology, evolving educational methodologies, and global occurrences such as the COVID-19 pandemic. The increasing need for tablets in online education can be attributed to their adaptability, portability, and capacity to accommodate a diverse array of educational applications. As digital learning continues to progress, tablets are anticipated to assume a more prominent role in the educational sector in the forecast period.
Europe stands as a significant player in the global retail e-commerce arena, ranking as the third largest market worldwide. In 2023, the region generated impressive total revenues amounting to approximately USD 631.9 billion. This robust figure underscores the growing importance of online shopping in the European economy and reflects changing consumer behaviours that increasingly favour digital transactions over traditional retail methods. Additionally, the European retail e-commerce market is poised for substantial growth. With an anticipated annual growth rate of 9.31%, projections indicate that by 2027, e-commerce sales in Europe could soar to an estimated USD 902.3 billion. This growth trajectory highlights not only the resilience of the e-commerce sector but also the evolving preferences of consumers who are increasingly turning to online platforms for their shopping needs.
Rising focus on remote work and learning; the development of advanced displays; technological advancements and innovations; and the growing focus on sustainability are driving the Europe tablet market expansion.
With the growing demand for mobile working and learning, the demand for tablets is significantly increasing as they are lightweight, boast extensive battery life, and provide enhanced flexibility and convenience.
The development of advanced, robust, and durable display technologies, including flexible OLED screens, to offer excellent display quality is expected to aid the market expansion in the forecast period.
Technological advancements and innovations are leading to the development of foldable tablets equipped with advanced security features and cameras to ensure the safety and security of data and provide users with high-quality videos and images.
With the growing environmental consciousness, key players are emphasising sustainability in tablet designs and using energy-efficient components and eco-friendly materials to reduce environmental footprint and deliver exceptional performance.
The market is benefitting from the rising trend of remote work and education. Due to their convenience, portability, versatility, and compact size, tablets are increasingly preferred as alternatives to laptops. The cost-effectiveness of tablets is also boosting their adoption for remote work and online education. Moreover, the integration of advanced technologies like artificial intelligence in tablets to enhance users’ experiences while optimising battery life and performance is anticipated to fuel the market development.
Europe Tablet Market Report and Forecast 2026-2035 offers a detailed analysis of the market based on the following segments:
Market Breakup by Operating System
Market Breakup by Screen Size
Market Breakup by End-Use
Market Breakup by Distribution Channel
Market Breakup by Country
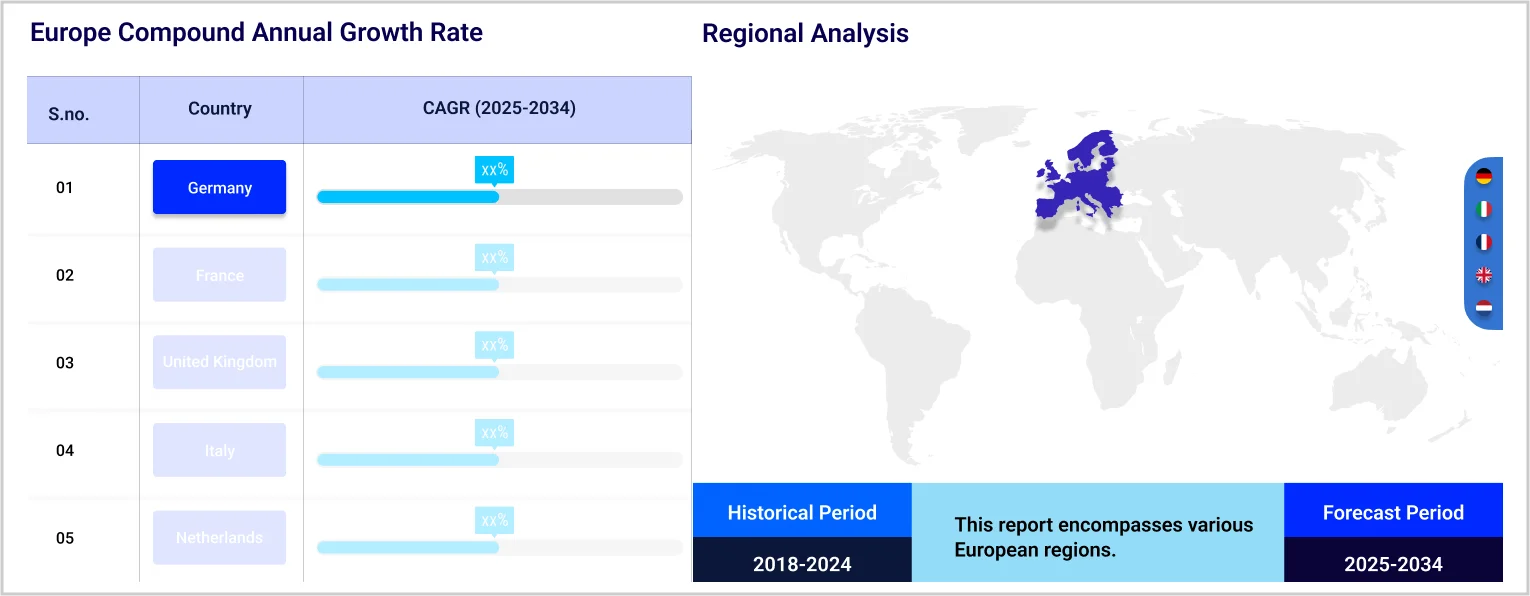
| CAGR 2026-2035 - Market by | Country |
| United Kingdom | 2.6% |
| Italy | 2.2% |
| Germany | XX% |
| France | XX% |
| Others | XX% |
Based on the screen size, the market is segmented into 8 inch and 8 inch and above. The 8 inch and above segment is projected to grow at a CAGR of 3.7% during the forecast period of 2026-2035. Tablets featuring screens measuring 8 inches or larger have gained significant popularity in both consumer and commercial sectors, attributed to their adaptability and improved user experience.
Major players are focusing on technological advancements and product innovation to gain a competitive edge in the market.
The comprehensive report looks into the macro and micro aspects of the market. The EMR report gives an in-depth insight into the market by providing a SWOT analysis as well as an analysis of Porter’s Five Forces model.


Upto 15% Off
USD
$3999 $3599
$2499 $2249
$4999 $4249
$5999 $5099


*While we strive to always give you current and accurate information, the numbers depicted on the website are indicative and may differ from the actual numbers in the main report. At Expert Market Research, we aim to bring you the latest insights and trends in the market. Using our analyses and forecasts, stakeholders can understand the market dynamics, navigate challenges, and capitalize on opportunities to make data-driven strategic decisions.*
Get in touch with us for a customized solution tailored to your unique requirements and save upto 35%!
In 2025, the market attained a volume of nearly 36.24 Million Units.
The market is assessed to grow at a CAGR of 2.40% between 2026 and 2035.
The market is estimated to reach around 45.94 Million Units by 2035.
The market is being driven by rising remote work and online learning and an increase in digital content consumption.
The key trends aiding the market expansion include the growing e-commerce sector and the manufacturing of modern tablet technology for better user experience.
The major distribution channels in the market are online and offline.
The major countries considered in the market are the United Kingdom, Germany, France, and Italy, among others.
The major players in the market are Apple Inc., Lenovo Group Ltd., Samsung Electronics Co. Ltd., AsusTek Computer Inc., LG Corporation, Acer Inc., Xiaomi Group, Nokia Corporation, Hewlett Packard Enterprise Development LP, and Microsoft Corporation, among others.
Explore our key highlights of the report and gain a concise overview of key findings, trends, and actionable insights that will empower your strategic decisions.
| REPORT FEATURES | DETAILS |
| Base Year | 2025 |
| Historical Period | 2019-2025 |
| Forecast Period | 2026-2035 |
| Scope of the Report |
Historical and Forecast Trends, Industry Drivers and Constraints, Historical and Forecast Market Analysis by Segment
|
| Breakup by Operating System |
|
| Breakup by Screen Size |
|
| Breakup by End Use |
|
| Breakup by Distribution Channel |
|
| Breakup by Region |
|
| Market Dynamics |
|
| Competitive Landscape |
|
| Companies Covered |
|
Single User License
One User
USD 3,999
USD 3,599
tax inclusive*
Datasheet
One User
USD 2,499
USD 2,249
tax inclusive*
Five User License
Five User
USD 4,999
USD 4,249
tax inclusive*
Corporate License
Unlimited Users
USD 5,999
USD 5,099
tax inclusive*
*Please note that the prices mentioned below are starting prices for each bundle type. Kindly contact our team for further details.*
Flash Bundle
Small Business Bundle
Growth Bundle
Enterprise Bundle
*Please note that the prices mentioned below are starting prices for each bundle type. Kindly contact our team for further details.*
Flash Bundle
Number of Reports: 3
20%
tax inclusive*
Small Business Bundle
Number of Reports: 5
25%
tax inclusive*
Growth Bundle
Number of Reports: 8
30%
tax inclusive*
Enterprise Bundle
Number of Reports: 10
35%
tax inclusive*
How To Order

Select License Type
Choose the right license for your needs and access rights.

Click on ‘Buy Now’
Add the report to your cart with one click and proceed to register.

Select Mode of Payment
Choose a payment option for a secure checkout. You will be redirected accordingly.
Gain insights to stay ahead and seize opportunities.

Get insights & trends for a competitive edge.

Track prices with detailed trend reports.

Analyse trade data for supply chain insights.

Leverage cost reports for smart savings

Enhance supply chain with partnerships.

Connect For More Information
Our expert team of analysts will offer full support and resolve any queries regarding the report, before and after the purchase.
Our expert team of analysts will offer full support and resolve any queries regarding the report, before and after the purchase.
We employ meticulous research methods, blending advanced analytics and expert insights to deliver accurate, actionable industry intelligence, staying ahead of competitors.
Our skilled analysts offer unparalleled competitive advantage with detailed insights on current and emerging markets, ensuring your strategic edge.
We offer an in-depth yet simplified presentation of industry insights and analysis to meet your specific requirements effectively.


Share