

Consumer Insights
Uncover trends and behaviors shaping consumer choices today
Procurement Insights
Optimize your sourcing strategy with key market data
Industry Stats
Stay ahead with the latest trends and market analysis.

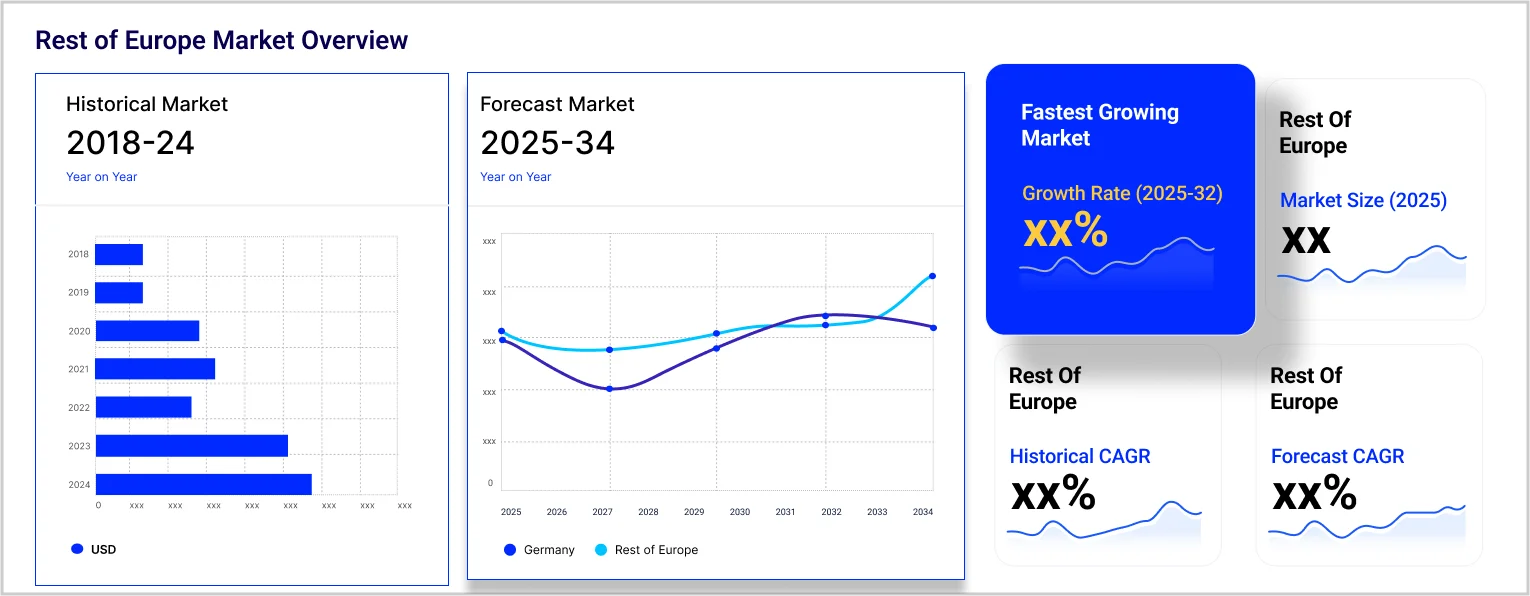
The Europe socks market reached approximately USD 12.25 Billion in 2025. The market is projected to grow at a CAGR of 5.30% between 2026 and 2035, reaching a value of around USD 20.53 Billion by 2035.
Base Year
Historical Period
Forecast Period
A total of 38% of Europeans engage in sports and exercise on a regular basis.
In March 2024, the EU's private consumption expenditure reached 2,471.523 billion USD.
In 2023, the majority of online shoppers, accounting for 44%, made purchases of clothes, shoes and accessories in Europe.
Compound Annual Growth Rate
5.3%
Value in USD Billion
2026-2035
*this image is indicative*
| Europe Socks Market Report Summary | Description | Value |
| Base Year | USD Billion | 2025 |
| Historical Period | USD Billion | 2019-2025 |
| Forecast Period | USD Billion | 2026-2035 |
| Market Size 2025 | USD Billion | 12.25 |
| Market Size 2035 | USD Billion | 20.53 |
| CAGR 2019-2025 | Percentage | XX% |
| CAGR 2026-2035 | Percentage | 5.30% |
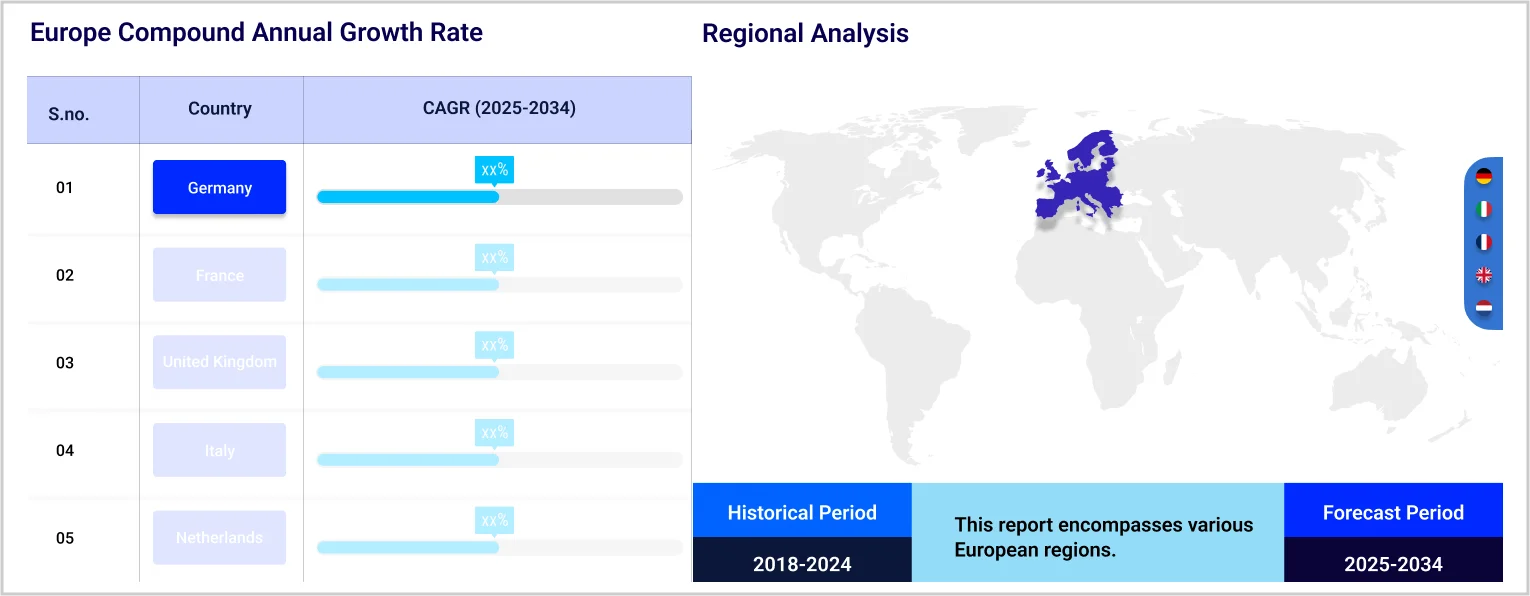
| CAGR 2026-2035 - Market by Country | France | 6.1% |
| CAGR 2026-2035 - Market by Country | Germany | 5.9% |
| CAGR 2026-2035 - Market by Product Type | Athletic Socks | 6.0% |
| CAGR 2026-2035 - Market by Distribution Channel | Online Channels | 9.5% |
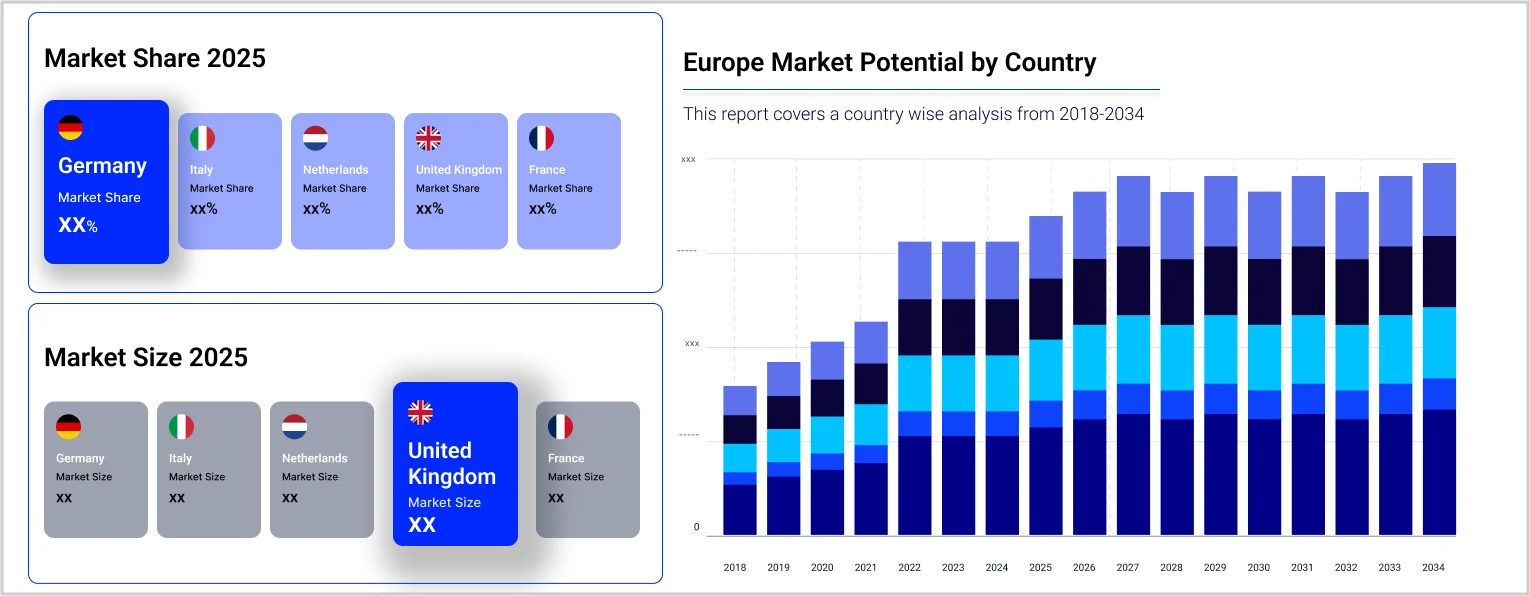
| 2025 Market Share by Country | United Kingdom | 18.4% |
The rise of online shopping has led to a significant increase in sock sales as consumers now have access to a wide range of products and brands. Europe ranks as the third largest retail e-commerce market globally, generating total revenues of USD 631.9 billion. It is projected that the annual growth rate of 9.31% will result in total European retail e-commerce sales reaching USD 902.3 billion by 2027. E-commerce penetration rates are expected to increase across all regions in Europe through 2029. The United Kingdom is forecasted to have the highest penetration rate in the e-commerce market at 97.25%, followed by Germany at 70% and France at 62%. Besides, the emergence of direct-to-consumer brands offering high-quality socks at competitive prices has disrupted traditional retail models.
Ireland holds the sixth position in the European Union regarding weekly sports participation among adults. In 2022, research conducted by Sport Ireland offers significant insights into the trends of sports participation and physical activity in the post-pandemic context. The report indicates a 3% increase in adult participation rates since 2021. It also reveals that 43% of the adult population engaged in sports on a weekly basis in 2022, reflecting a rise of 3%. The significant increase in routine physical activities, such as running, gym sessions, yoga, and team sports, is fuelling the need for comfortable and stylish athleisure socks. As a result, there is a rising interest in performance socks that offer comfort, support, and longevity.
“Europe Socks Market Report and Forecast 2026-2035” offers a detailed analysis of the market based on the following segments:
Market Breakup by Product Type
Market Breakup by Material Type
Market Breakup by Demographics
Market Breakup by Distribution Channel
Market Breakup by Country
| CAGR 2026-2035 - Market by | Country |
| France | 6.1% |
| Germany | 5.9% |
| United Kingdom | XX% |
| Italy | XX% |
| Others | XX% |
Based on the distribution channel, the market is segmented into hypermarkets/supermarkets, convenience stores, and online channels, among others. Online channels are projected to grow at a CAGR of 9.5% during the forecast period of 2026-2035.The convenience of online shopping enables consumers to explore and acquire different types of products including socks from a diverse selection. This accessibility is attractive, as it facilitates straightforward comparisons of prices and styles among various brands and platforms.
| 2025 Market Share by | Country |
| United Kingdom | 18.4% |
| Germany | XX% |
| France | XX% |
| Italy | XX% |
| Others | XX% |
Major players are focusing on product innovation and ethical production practices to gain a competitive edge in the market.


Upto 15% Off
USD
$3999 $3599
$2499 $2249
$4999 $4249
$5999 $5099


*While we strive to always give you current and accurate information, the numbers depicted on the website are indicative and may differ from the actual numbers in the main report. At Expert Market Research, we aim to bring you the latest insights and trends in the market. Using our analyses and forecasts, stakeholders can understand the market dynamics, navigate challenges, and capitalize on opportunities to make data-driven strategic decisions.*
Get in touch with us for a customized solution tailored to your unique requirements and save upto 35%!
In 2025, the market reached an approximate value of USD 12.25 Billion in 2025.
The market is estimated to grow at a CAGR of 5.30% between 2026 and 2035.
The market is estimated to witness a healthy growth during 2026-2035 to reach around USD 20.53 Billion by 2035.
The market is being driven by rising disposable income, increasing spending on consumer goods, and rising health and fitness activities.
The key trends aiding the market expansion include the growth of online sales channels, increasing social media marketing, and rising recreational and outdoor activities.
The different distribution channels of socks include hypermarkets/supermarkets, convenience stores, and online channels, among others.
The major countries included in the market are the United Kingdom, Germany, France, and Italy, among others.
The major players in the market are Nike, Inc., Adidas AG, Puma SE, USPA Global Licensing, Inc., New Balance Athletics, Inc., YONEX Co., Ltd., Li-Ning Studio LLP, Under Armour, Inc., Pantherella International Group Ltd., and FALKE KGaA, among others.
Explore our key highlights of the report and gain a concise overview of key findings, trends, and actionable insights that will empower your strategic decisions.
| REPORT FEATURES | DETAILS |
| Base Year | 2025 |
| Historical Period | 2019-2025 |
| Forecast Period | 2026-2035 |
| Scope of the Report |
Historical and Forecast Trends, Industry Drivers and Constraints, Historical and Forecast Market Analysis by Segment:
|
| Breakup by Product Type |
|
| Breakup by Material Type |
|
| Breakup by Demographics |
|
| Breakup by Distribution Channel |
|
| Breakup by Region |
|
| Market Dynamics |
|
| Competitive Landscape |
|
| Companies Covered |
|
Single User License
One User
USD 3,999
USD 3,599
tax inclusive*
Datasheet
One User
USD 2,499
USD 2,249
tax inclusive*
Five User License
Five User
USD 4,999
USD 4,249
tax inclusive*
Corporate License
Unlimited Users
USD 5,999
USD 5,099
tax inclusive*
*Please note that the prices mentioned below are starting prices for each bundle type. Kindly contact our team for further details.*
Flash Bundle
Small Business Bundle
Growth Bundle
Enterprise Bundle
*Please note that the prices mentioned below are starting prices for each bundle type. Kindly contact our team for further details.*
Flash Bundle
Number of Reports: 3
20%
tax inclusive*
Small Business Bundle
Number of Reports: 5
25%
tax inclusive*
Growth Bundle
Number of Reports: 8
30%
tax inclusive*
Enterprise Bundle
Number of Reports: 10
35%
tax inclusive*
How To Order

Select License Type
Choose the right license for your needs and access rights.

Click on ‘Buy Now’
Add the report to your cart with one click and proceed to register.

Select Mode of Payment
Choose a payment option for a secure checkout. You will be redirected accordingly.
Gain insights to stay ahead and seize opportunities.

Get insights & trends for a competitive edge.

Track prices with detailed trend reports.

Analyse trade data for supply chain insights.

Leverage cost reports for smart savings

Enhance supply chain with partnerships.

Connect For More Information
Our expert team of analysts will offer full support and resolve any queries regarding the report, before and after the purchase.
Our expert team of analysts will offer full support and resolve any queries regarding the report, before and after the purchase.
We employ meticulous research methods, blending advanced analytics and expert insights to deliver accurate, actionable industry intelligence, staying ahead of competitors.
Our skilled analysts offer unparalleled competitive advantage with detailed insights on current and emerging markets, ensuring your strategic edge.
We offer an in-depth yet simplified presentation of industry insights and analysis to meet your specific requirements effectively.


Share