

Consumer Insights
Uncover trends and behaviors shaping consumer choices today
Procurement Insights
Optimize your sourcing strategy with key market data
Industry Stats
Stay ahead with the latest trends and market analysis.

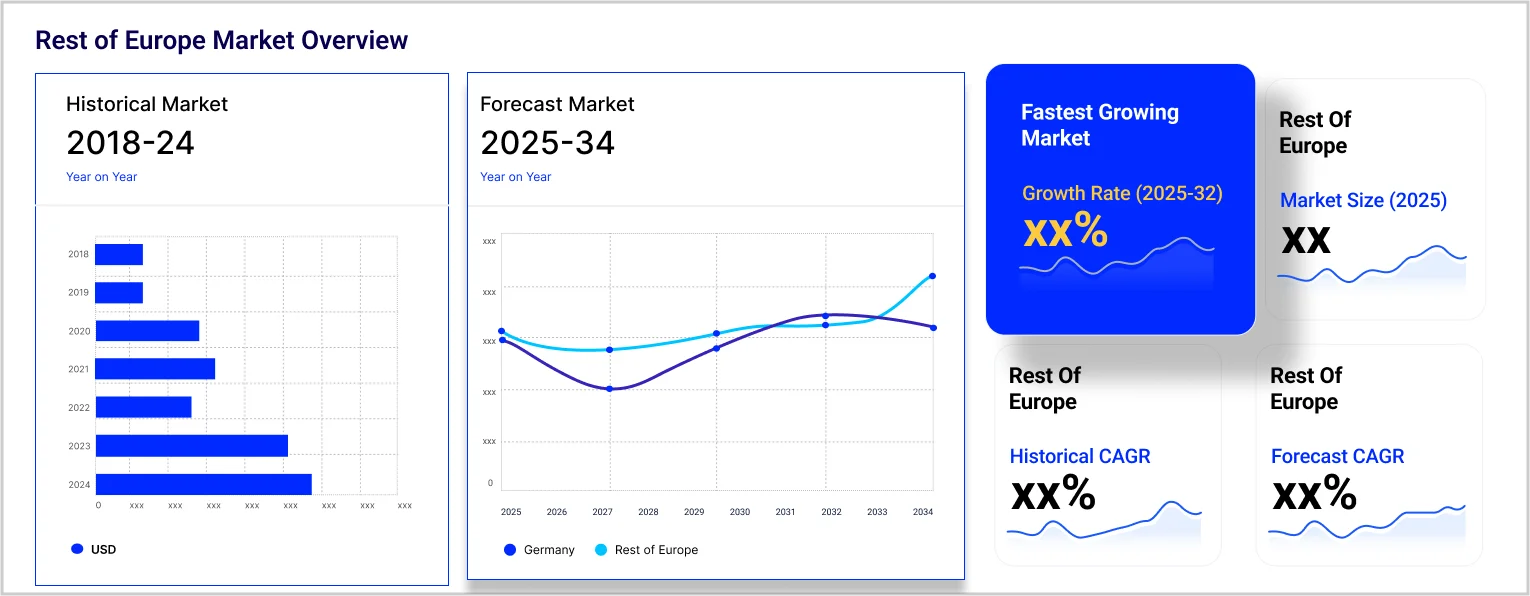
The Europe silica sand market was volumed at 82.10 MMT in 2025. The industry is expected to grow at a CAGR of 4.10% during the forecast period of 2026-2035. The growing utilization of silica sand in hydraulic fracturing (fracking) for oil and gas extraction in Europe is a significant factor that boosts the demand for high-quality frac sand. In turn, all these factors have resulted in the market attaining a volume of 122.70 MMT by 2035.
Base Year
Historical Period
Forecast Period
The attention around luxury glass packaging is flourishing in Europe, mainly fueled by the alcohol, cosmetics and pharmaceuticals sectors. The above trend presents silica sand manufacturers to grow product lines and market share, further boosting the growth in the Europe silica sand market.
High-purity silica sand is primarily used in advanced glass applications, which are expanded by innovations such as energy-efficient and self-cleaning glass. Hence, B2B companies can expand on this emerging trend and export silica sand to developing regions.
Moreover, silica sand demand is exhibiting growth owing to the Europe government or its authorities adopted of glass use in infrastructure as well as green construction that bolsters further demand in the market.
Compound Annual Growth Rate
4.1%
Value in MMT
2026-2035
*this image is indicative*
|
Europe Silica Sand Market Report Summary |
Description |
Value |
|
Base Year |
MMT |
2025 |
|
Historical Period |
MMT |
2019-2025 |
|
Forecast Period |
MMT |
2026-2035 |
|
Market Size 2025 |
MMT |
82.10 |
|
Market Size 2035 |
MMT |
122.70 |
|
CAGR 2019-2025 |
Percentage |
XX% |
|
CAGR 2026-2035 |
Percentage |
4.10% |
|
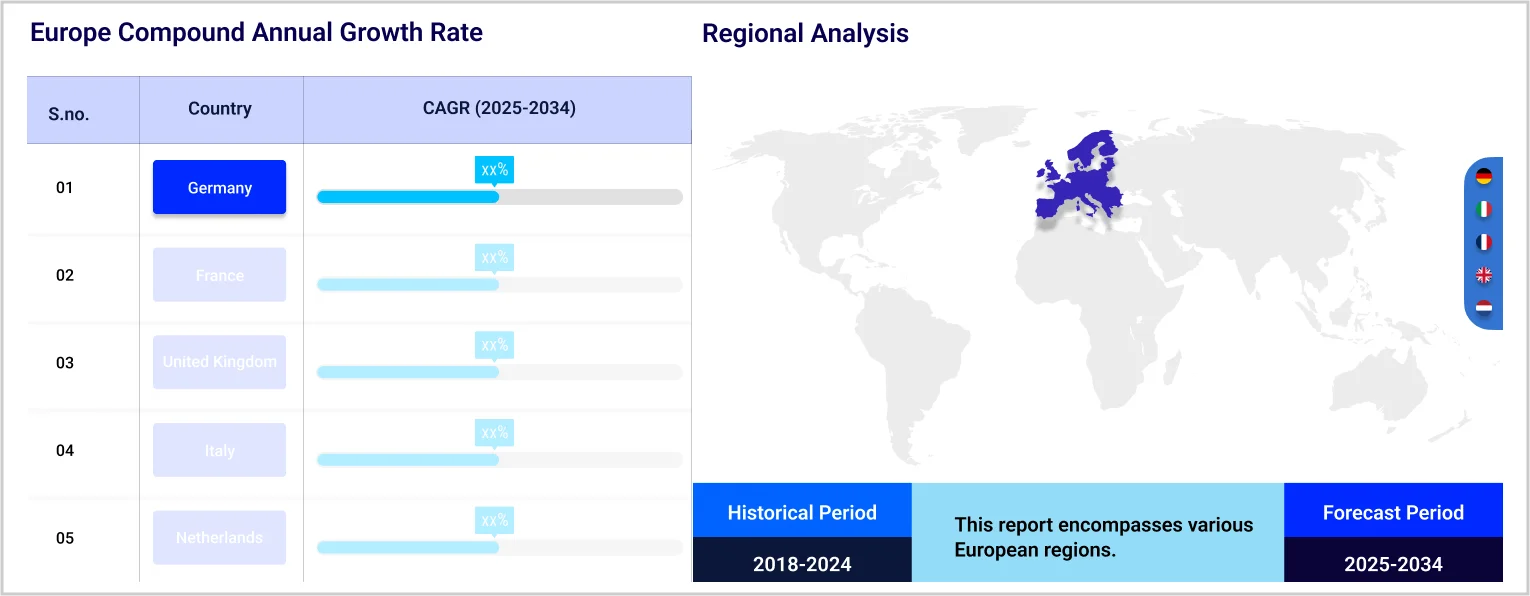
CAGR 2026-2035 - Market by Country |
United Kingdom |
4.7% |
|
CAGR 2026-2035 - Market by Country |
Germany |
4.4% |
|
CAGR 2026-2035 - Market by Applications |
Glass Manufacturing |
5.6% |
|
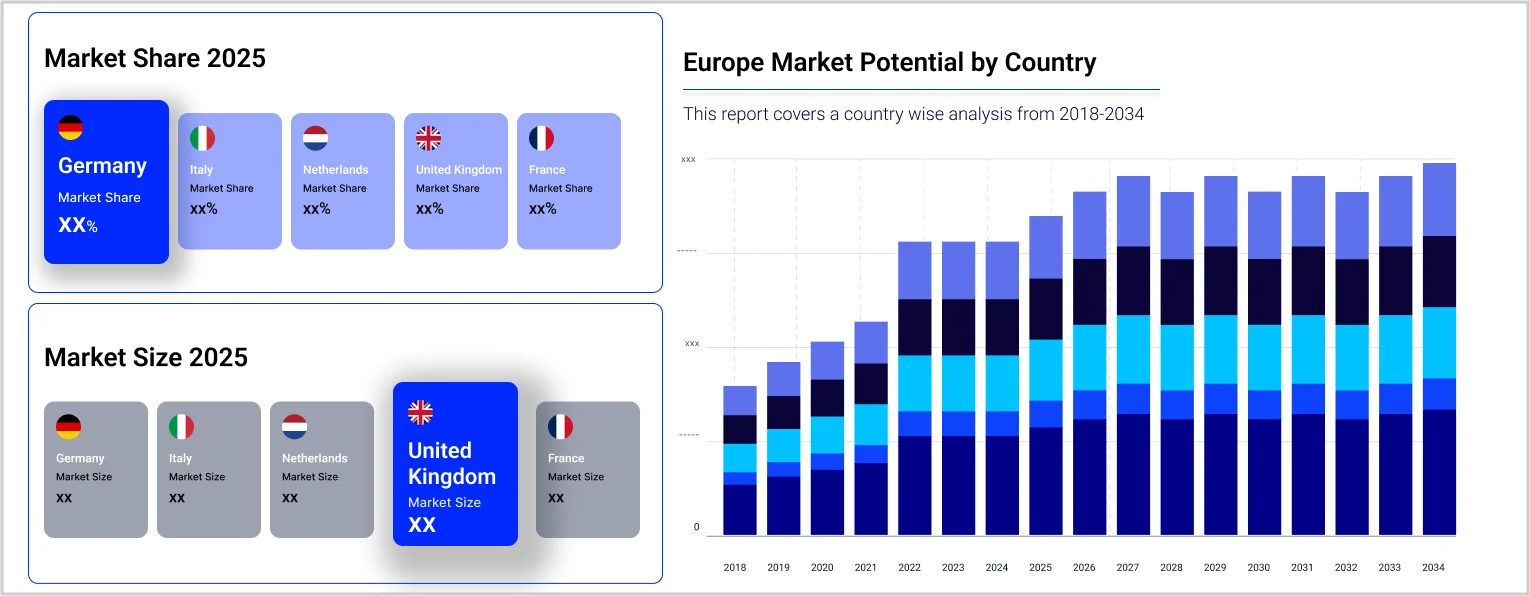
2025 Market Share by Country |
United Kingdom |
17.4% |
Growing demand from glass, construction, and foundry sectors is fueling the growth of the Europe silica sand market. Increasing demand for high-performance glass, especially in the automotive and solar sectors, is paving the way for market growth. Furthermore, the demand for silica sand in concrete and several other building applications is growing on the back of the construction boom in Europe, which focuses on sustainable and durable options. Core trends range from innovation in new green extraction processes to engineering conventional silica sand products for unique niche applications such as water filtration and hydraulic fracturing. Top players, including Sibelco, Saint-Gobain, and Unimin Corporation, are embracing sustainable methods, expanding their product offerings, and growing geographically to gain greater market share.
Increasing glass manufacturing is the driving factor for the Europe silica sand market growth. Silica sand is the essential ingredient in the production of flat glass for transport and building use. Moreover, the growing demand for energy-efficient and green glass solutions such as self-cleaning and solar glass are driving the demand of the target product, particularly in Italy, France, and Germany. Silica sand itself holds a substantial fulfillment of demand across Europe via various applications notably among which are water filtration in drinking and wastewater treatment respectively. Increasing concern about water quality and sustainability are driving demand for high-purity silica sand for filtration applications — another major market niche.
The key trends of the Europe silica sand market include sustainability, solar energy demand, specialty glass growth, and digitalization.
New demand for more sustainable methods for silica sand is emerging. Companies are developing more environmentally friendly extraction methods, such as lowering energy consumption and creating water recycling systems, thereby boosting the Europe silica sand market growth. For instance, Sibelco has pledged to decrease its carbon output and improve environmentally sustainable operations by implementing more eco-efficient solutions, reflecting the need for heightened environmental concern from European industries and improving their market standing.
The increasing push from Europe towards renewables, most notably solar, has created huge demand for high-grade sand for photovoltaic (solar) panels. The increasing adoption of solar energy has also surged the demand for silica sand in Europe particularly in countries such as Germany and Spain. Companies like Saint-Gobain are strategically catering to this need for the materials required for this burgeoning market, tapping into a lucrative sector that meets Europe’s green energy ambitions.
Renovation and construction activities have also contributed to an upward demand trajectory for specialty glass which encompasses self-cleaning, decorative, etc., remaining energy-efficient. This has further boosted the Europe silica sand market dynamics. Quality silica sand is indispensable for these advanced glass products. European countries are pouring investments into infrastructure projects and energy-efficient buildings, and companies like Guardian Glass are innovating their products to fill the void. This trend not only fuels the sale of silica sand but also stimulates the progress of new glass technologies and paves way for new applications.
As technology advances at a rapid pace, silica sand producers are adopting digital solutions for quality and production control, thereby accelerating the Europe silica sand market revenues. Unimin Corporation, for example, integrates automation and advanced data analytics into its manufacturing processes to deliver products that are consistent and of high quality. This trend leads to high reliability of the products, reduces waste, and suppliers meeting individual customer requirements, contributing to the supplier's competitiveness in the market.
The rising demand for silica sand in Europe from industrial applications, especially for metal casting and in foundry processes, provides a big opportunity for companies to grow. With Europe even more focused on manufacturing and automotive, companies can fulfil this niche by accessing high-quality silica sand necessary for casting, mold-making and other specialized industrial applications. In addition, growing environmental concerns over both the quality and quantity of water indicate the greater usage of silica sand in water filtration systems throughout Europe. Companies can take advantage of this situation by manufacturing high-purity silica sand (HPSS) for application in advanced filtration technologies. This trend is a new source of revenue, aligned with Europe’s sustainability objectives.
Urbanization and infrastructure expansion in the region bolster its booming construction industry, fueling the Europe silica sand market value. This sand has become increasingly important in creating concrete, glass and various building materials and bolstering the region’s ongoing growth cycle of residential, commercial and industrial development. In addition, the increasing need for advanced glass products such as smart glass and energy-efficient windows is propelling the European market. Diverse application of advanced glass technologies for manufacturing new glass, requires high-purity silica sand which is expected to gain traction in the market and create substantial opportunity for the producers catering to these niche set of industries.
The EMR’s report titled “Europe Silica Sand Market Report and Forecast 2026-2035” offers a detailed analysis of the market based on the following segments:
Market Breakup by Application
Market Breakup by Region
Market Insights by Application
There has been increasing demand for high-performance glass in automotive and architecture industries, which is a major driver in the glass manufacturing industry and has played a significant role in shaping the Europe silica sand market dynamics. Foundry applications related to industrial production are booming. In chemical manufacturing, silica sand is needed to produce silicon and various other compounds. Construction requires concrete and building materials. Others, such as silica in paints and coatings, mainly contribute to texture and durability. The demand for both water treatment and filtration is increasing. The oil and gas industry is ramping up frac sand demand, and the ceramics and refractories sectors are taking advantage of silica's resistance to high heat in industrial processing.
Germany Silica Sand Market Insights
The silica sand market in Germany is thriving due to its robust automotive, manufacturing and solar energy sectors. Silica sand is used in high-performance glass including vehicle windshields and solar panels. As Germany transitions to renewable energy and sustainable manufacturing, there is added demand for specialized silica sand. The market is poised to grow with a CAGR of 4.4% in the forecasted period.
France Silica Sand Market Growth
The demand for silica sand in France is driven by the country's attempts to focus more on sustainable construction practices and infrastructure projects. The growing usage of silica for specialty glass production, including energy-efficient windows and solar panels, in addition to increasing green building initiatives is expected to drive the regional market growth.
United Kingdom Silica Sand Market Opportunities
The United Kingdom silica sand market is driven by the growing construction and glass production industry. This market is expected to grow at a CAGR of 4.7% during the forecast period. With a fervent focus on infrastructure development and green construction materials in the country, the usage of high-grade silica sand is taking a leap for a range of constructional projects including buildings, roads and bridges fueling the demand forecast.
|
CAGR 2026-2035 - Market by |
Country |
|
United Kingdom |
4.7% |
|
Germany |
4.4% |
|
France |
4.2% |
|
Italy |
XX% |
|
Norway |
XX% |
|
Others |
XX% |
Italy Silica Sand Market Outlook
The Italy silica sand market growth is majorly supported by the expanding construction industry as silica sand is mainly used in cement, mortar and glass. The booming infrastructure developments in the country, coupled with increasing demand for high grade glass in automotive and packaging industries, are fueling further demand.
Norway Silica Sand Market Dynamics
The increased demand for silica sand in Norway is driven by its large investments in infrastructure projects, especially in the oil and gas sector. It is also used in hydraulic fracturing and to manufacture high-quality glass. Demand for silica sand is anticipated to expand as Norway's industrial and energy sectors grow.
Europe silica sand market players seek to increase their production capacities, improve sustainability, and achieve greater efficiency across their supply chains. Most of the Europe silica sand companies are concentrating on eco-friendly mining practices that are aligned with providing high-quality sand for multiple industries, including glass and construction.
SCR-Sibelco NV, established 1872, is a global leader in industrial minerals headquartered in Antwerp, Belgium. The company has grown to be a popular name as a quartz sand, silica sand supplier, mining and export company holding major share in the overall global market.
Founded in 1983, Euroquarz GmbH is based in Dorsten, Germany, and produces and supplies high-purity silica sand. Dedicated to quality control, efficiency and sustainable resource management, the company serves industries such as glass, ceramics and construction.
Minerali Industriali S.r.l. based in Italy, and founded in 1998 is a leading producer of silica sand. The company specializes in intermediate raw materials for the glass, foundry and construction industries, prioritizing sustainable mining practices and supplying quality products.
Mitsubishi Corporation is a leading Japanese conglomerate headquartered in Tokyo and incorporated in 1870, with a key role in the global market for silica sand. Their activities cover trading and high-grade industrial media supply for construction, glass, automotive, etc.
*Please note that this is only a partial list; the complete list of key players is available in the full report. Additionally, the list of key players can be customized to better suit your needs.*
Other key players in the Europe silica sand market report are Quarzwerke Group, Schlingmeier Quarzsand, Saint-Gobain SAMIN, Strobel Quarzsand GmbH, Aggregate Industries UK Limited, and Fulchiron Industrielle, among others.


Upto 15% Off
USD
$2499 $2249
$3999 $3599
$4999 $4249
$5999 $5099


*While we strive to always give you current and accurate information, the numbers depicted on the website are indicative and may differ from the actual numbers in the main report. At Expert Market Research, we aim to bring you the latest insights and trends in the market. Using our analyses and forecasts, stakeholders can understand the market dynamics, navigate challenges, and capitalize on opportunities to make data-driven strategic decisions.*
Get in touch with us for a customized solution tailored to your unique requirements and save upto 35%!
In 2025, the Europe silica sand market reached an approximate volume of 82.10 MMT.
The market is projected to grow at a CAGR of 4.10% between 2026 and 2035.
The market is estimated to witness healthy growth in the forecast period of 2026-2035 to reach a volume of around 122.70 MMT by 2035.
The major drivers of the market are growing utilization of silica sand in hydraulic fracturing (fracking) for oil and gas extraction, urbanization, infrastructure expansion, and the increasing need for advanced glass products.
The key trends of the market include sustainability, solar energy demand, specialty glass growth, and digitalization.
The major regions in the market are Germany, France, United Kingdom, Italy, Norway, and others.
The various applications considered in the market report are glass manufacturing, foundry, chemical production, construction, paints and coatings, ceramics and refractories, filtration, oil and gas, and others.
The major players in the market are SCR-Sibelco NV, Euroquarz GmbH, Minerali Industriali S.r.l., Mitsubishi Corporation, Quarzwerke Group, Schlingmeier Quarzsand, Saint-Gobain SAMIN, Strobel Quarzsand GmbH, Aggregate Industries UK Limited, and Fulchiron Industrielle, among others.
Explore our key highlights of the report and gain a concise overview of key findings, trends, and actionable insights that will empower your strategic decisions.
| REPORT FEATURES | DETAILS |
| Base Year | 2025 |
| Historical Period | 2019-2025 |
| Forecast Period | 2026-2035 |
| Scope of the Report |
Historical and Forecast Trends, Industry Drivers and Constraints, Historical and Forecast Market Analysis by Segment:
|
| Breakup by Applications |
|
| Breakup by Region |
|
| Market Dynamics |
|
| Competitive Landscape |
|
| Companies Covered |
|
Datasheet
One User
USD 2,499
USD 2,249
tax inclusive*
Single User License
One User
USD 3,999
USD 3,599
tax inclusive*
Five User License
Five User
USD 4,999
USD 4,249
tax inclusive*
Corporate License
Unlimited Users
USD 5,999
USD 5,099
tax inclusive*
*Please note that the prices mentioned below are starting prices for each bundle type. Kindly contact our team for further details.*
Flash Bundle
Small Business Bundle
Growth Bundle
Enterprise Bundle
*Please note that the prices mentioned below are starting prices for each bundle type. Kindly contact our team for further details.*
Flash Bundle
Number of Reports: 3
20%
tax inclusive*
Small Business Bundle
Number of Reports: 5
25%
tax inclusive*
Growth Bundle
Number of Reports: 8
30%
tax inclusive*
Enterprise Bundle
Number of Reports: 10
35%
tax inclusive*
How To Order

Select License Type
Choose the right license for your needs and access rights.

Click on ‘Buy Now’
Add the report to your cart with one click and proceed to register.

Select Mode of Payment
Choose a payment option for a secure checkout. You will be redirected accordingly.
Gain insights to stay ahead and seize opportunities.

Get insights & trends for a competitive edge.

Track prices with detailed trend reports.

Analyse trade data for supply chain insights.

Leverage cost reports for smart savings

Enhance supply chain with partnerships.

Connect For More Information
Our expert team of analysts will offer full support and resolve any queries regarding the report, before and after the purchase.
Our expert team of analysts will offer full support and resolve any queries regarding the report, before and after the purchase.
We employ meticulous research methods, blending advanced analytics and expert insights to deliver accurate, actionable industry intelligence, staying ahead of competitors.
Our skilled analysts offer unparalleled competitive advantage with detailed insights on current and emerging markets, ensuring your strategic edge.
We offer an in-depth yet simplified presentation of industry insights and analysis to meet your specific requirements effectively.


Share