

Consumer Insights
Uncover trends and behaviors shaping consumer choices today
Procurement Insights
Optimize your sourcing strategy with key market data
Industry Stats
Stay ahead with the latest trends and market analysis.

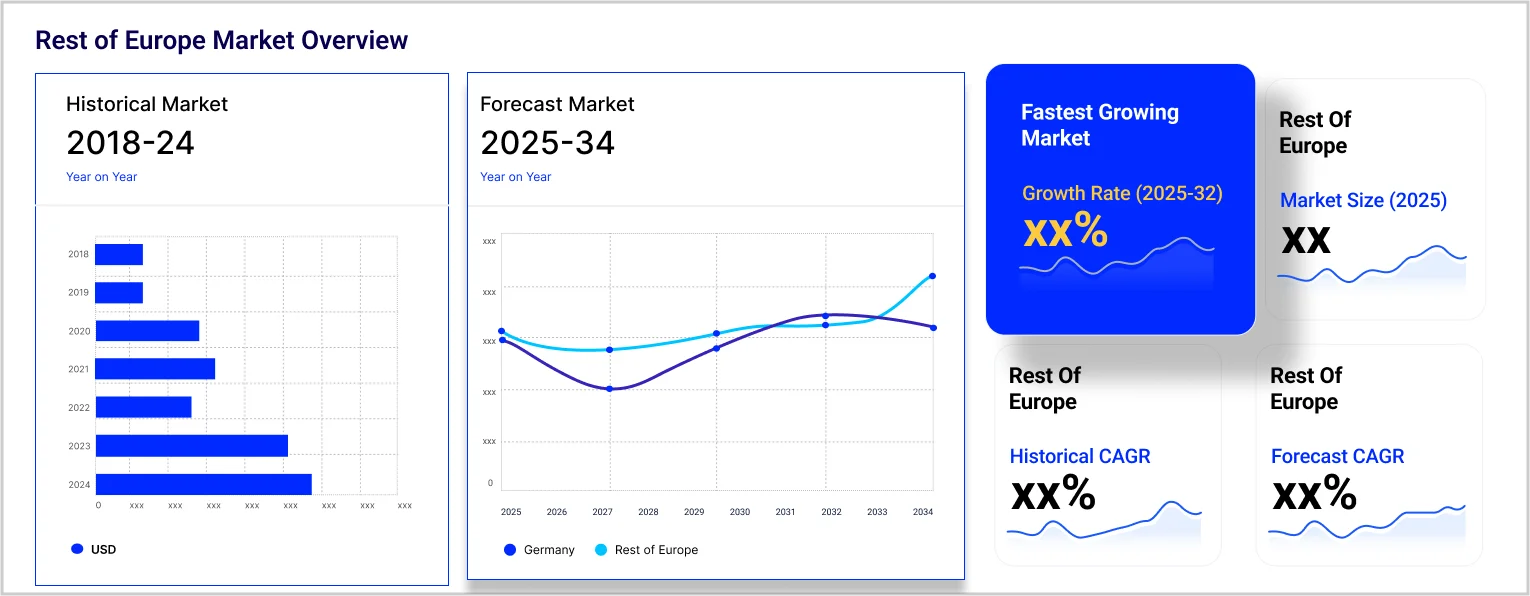
The Europe cider market reached approximately USD 1.79 Billion in 2025. The market is projected to grow at a CAGR of 3.30% between 2026 and 2035, reaching a value of around USD 2.48 Billion by 2035.
Base Year
Historical Period
Forecast Period
According to Eurostat, in 2022, 12.6 million tonnes of apples were produced by the EU.
The average annual alcohol consumption for adults in the European Region is 9.2 litres of pure alcohol.
Poland, Italy, and France were the top apple producers in the EU in 2022, with market shares of 34%, 18%, and 14% respectively.
Compound Annual Growth Rate
3.3%
Value in USD Billion
2026-2035
*this image is indicative*
| Europe Cider Market Report Summary | Description | Value |
| Base Year | USD Billion | 2025 |
| Historical Period | USD Billion | 2019-2025 |
| Forecast Period | USD Billion | 2026-2035 |
| Market Size 2025 | USD Billion | 1.79 |
| Market Size 2035 | USD Billion | 2.48 |
| CAGR 2019-2025 | Percentage | XX% |
| CAGR 2026-2035 | Percentage | 3.30% |
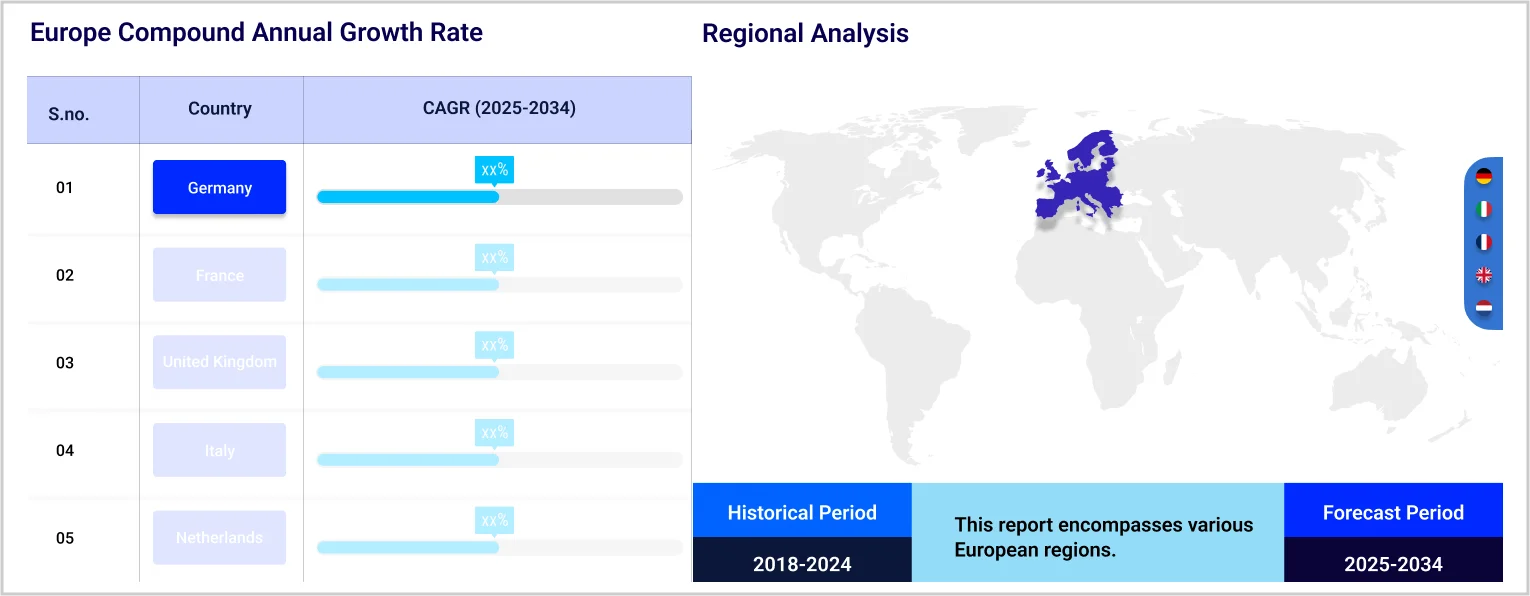
| CAGR 2026-2035 - Market by Country | United Kingdom | 3.5% |
| CAGR 2026-2035 - Market by Country | Germany | 3.2% |
| CAGR 2026-2035 - Market by Type | Flavoured | 3.6% |
| CAGR 2026-2035 - Market by Packaging | Cans | 3.8% |
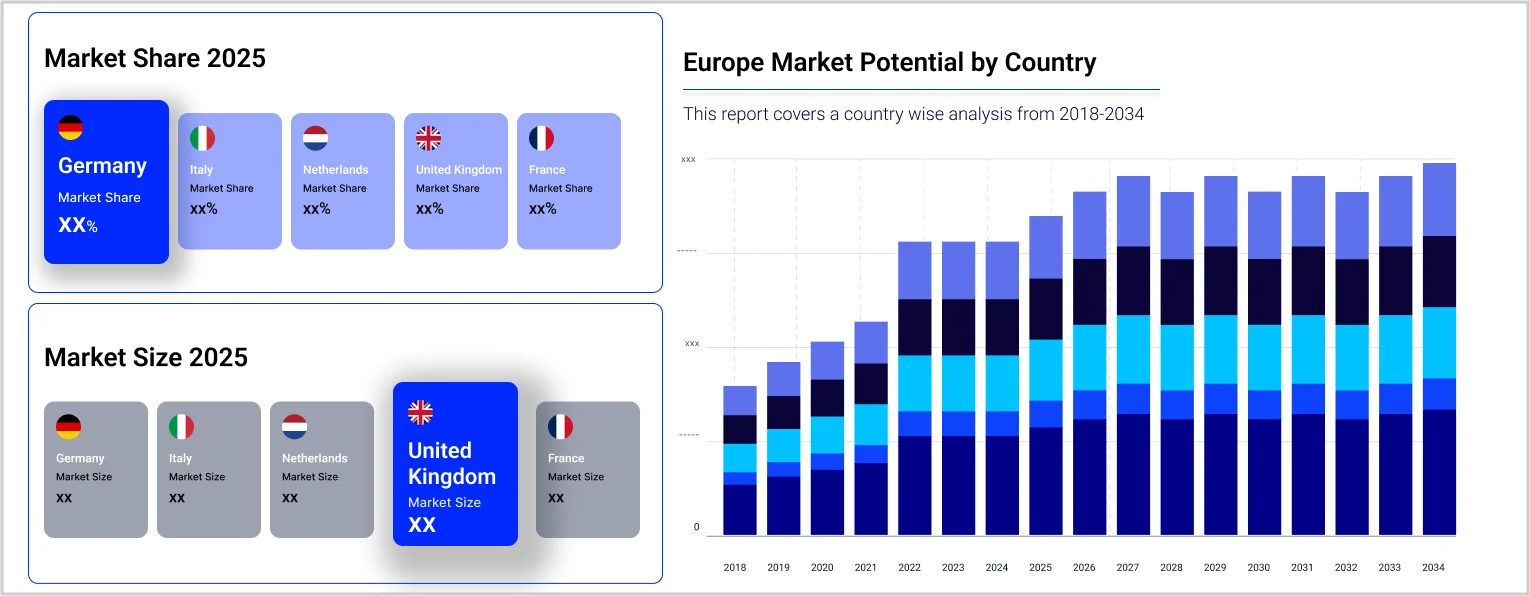
| 2025 Market Share by Country | United Kingdom | 16.3% |
The European Union's apple production volume reached 11.5 million tonnes in 2020, making apples one of the top 5 most traded fruits in Europe with a total trade value of €2,270 million. The largest demand for imported apples comes from Germany and the United Kingdom. In 2020, Germany alone produced 973,000 tonnes of apples, accounting for approximately 70% of the total production. France stands out with an apple consumption of nearly 25 kg per capita, far exceeding the European average of 15.4 kg.
The median equivalised disposable income in the EU reached 18 706 purchasing power standards (PPS) per inhabitant in 2022, marking an increase from the 2021 figure of 18 011 purchasing power standards. Moreover, in 2021, the average per capita purchasing power in Europe was €15,055. With the rise in disposable incomes, consumers now have greater financial flexibility to allocate towards non-essential items, such as alcoholic beverages like cider. Consequently, this has resulted in heightened sales as consumers exhibit a greater willingness to explore new products and premium offerings.
There is a growing demand among consumers for beverages that utilise natural and organic ingredients. This trend has resulted in an increase in the production of ciders crafted from organic apples and free from artificial additives. Additionally, cider, being a naturally gluten-free option, attracts individuals with gluten sensitivities or celiac disease, which corresponds with wider health trends.
“Europe Cider Market Report and Forecast 2026-2035” offers a detailed analysis of the market based on the following segments:
Market Breakup by Type
Market Breakup by Packaging
Market Breakup by Distribution Channel
Market Breakup by Country
| CAGR 2026-2035 - Market by | Country |
| United Kingdom | 3.5% |
| Germany | 3.2% |
| France | XX% |
| Italy | XX% |
| Others | XX% |
Based on the type, the market is segmented into flavoured and plain. The flavoured segment is projected to grow at a CAGR of 3.6% during the forecast period of 2026-2035. The increasing popularity of flavoured cider can be ascribed to a variety of factors, including evolving consumer tastes, the impact of the craft beverage trend, improvements in production methods, strategic marketing efforts, and an emphasis on health-oriented options.
Major players are focusing on flavour innovation and ethical sourcing to gain a competitive edge in the market.


Upto 15% Off
USD
$2499 $2249
$3999 $3599
$4999 $4249
$5999 $5099


*While we strive to always give you current and accurate information, the numbers depicted on the website are indicative and may differ from the actual numbers in the main report. At Expert Market Research, we aim to bring you the latest insights and trends in the market. Using our analyses and forecasts, stakeholders can understand the market dynamics, navigate challenges, and capitalize on opportunities to make data-driven strategic decisions.*
Get in touch with us for a customized solution tailored to your unique requirements and save upto 35%!
In 2025, the market reached an approximate value of USD 1.79 Billion.
The market is estimated to grow at a CAGR of 3.30% between 2026 and 2035.
The market is estimated to witness a healthy growth during 2026-2035 to reach around USD 2.48 Billion by 2035.
The market is being driven by rising disposable incomes, growing apple production in the region, and the growing popularity of craft ciders.
The key trends aiding the market expansion include the rise in cider tourism and the sourcing of organically produced apples.
The major countries considered in the market are the United Kingdom, Germany, France, and Italy, among others.
The different distribution channels of cider include on-trade and off-trade.
The major players in the market are Heineken N.V., Carlsberg Group, ANHEUSER-BUSCH INBEV SA/NV, Asahi Group Holdings, Ltd., C & C Group plc, Molson Coors Beverage Company, Boston Beer Corporation, Aston Manor Limited, H. Westons & Sons Limited, and Thatchers Cider Company Limited, among others.
Explore our key highlights of the report and gain a concise overview of key findings, trends, and actionable insights that will empower your strategic decisions.
| REPORT FEATURES | DETAILS |
| Base Year | 2025 |
| Historical Period | 2019-2025 |
| Forecast Period | 2026-2035 |
| Scope of the Report |
Historical and Forecast Trends, Industry Drivers and Constraints, Historical and Forecast Market Analysis by Segment:
|
| Breakup by Type |
|
| Breakup by Packaging |
|
| Breakup by Distribution Channel |
|
| Breakup by Country |
|
| Market Dynamics |
|
| Competitive Landscape |
|
| Companies Covered |
|
Datasheet
One User
USD 2,499
USD 2,249
tax inclusive*
Single User License
One User
USD 3,999
USD 3,599
tax inclusive*
Five User License
Five User
USD 4,999
USD 4,249
tax inclusive*
Corporate License
Unlimited Users
USD 5,999
USD 5,099
tax inclusive*
*Please note that the prices mentioned below are starting prices for each bundle type. Kindly contact our team for further details.*
Flash Bundle
Small Business Bundle
Growth Bundle
Enterprise Bundle
*Please note that the prices mentioned below are starting prices for each bundle type. Kindly contact our team for further details.*
Flash Bundle
Number of Reports: 3
20%
tax inclusive*
Small Business Bundle
Number of Reports: 5
25%
tax inclusive*
Growth Bundle
Number of Reports: 8
30%
tax inclusive*
Enterprise Bundle
Number of Reports: 10
35%
tax inclusive*
How To Order

Select License Type
Choose the right license for your needs and access rights.

Click on ‘Buy Now’
Add the report to your cart with one click and proceed to register.

Select Mode of Payment
Choose a payment option for a secure checkout. You will be redirected accordingly.
Gain insights to stay ahead and seize opportunities.

Get insights & trends for a competitive edge.

Track prices with detailed trend reports.

Analyse trade data for supply chain insights.

Leverage cost reports for smart savings

Enhance supply chain with partnerships.

Connect For More Information
Our expert team of analysts will offer full support and resolve any queries regarding the report, before and after the purchase.
Our expert team of analysts will offer full support and resolve any queries regarding the report, before and after the purchase.
We employ meticulous research methods, blending advanced analytics and expert insights to deliver accurate, actionable industry intelligence, staying ahead of competitors.
Our skilled analysts offer unparalleled competitive advantage with detailed insights on current and emerging markets, ensuring your strategic edge.
We offer an in-depth yet simplified presentation of industry insights and analysis to meet your specific requirements effectively.


Share