

Consumer Insights
Uncover trends and behaviors shaping consumer choices today
Procurement Insights
Optimize your sourcing strategy with key market data
Industry Stats
Stay ahead with the latest trends and market analysis.

The global electronic lab notebook market size was estimated at USD 680.75 Million in 2025 and expected to grow at a CAGR of 5.20% in the forecast period of 2026-2035, reaching almost USD 1130.17 Million by 2035.
Base Year
Historical Period
Forecast Period
Compound Annual Growth Rate
5.2%
Value in USD Million
2026-2035
*this image is indicative*
| Global Electronic Lab Notebook Market Report Summary | Description | Value |
| Base Year | USD Million | 2025 |
| Historical Period | USD Million | 2019-2025 |
| Forecast Period | USD Million | 2026-2035 |
| Market Size 2025 | USD Million | 680.75 |
| Market Size 2035 | USD Million | 1130.17 |
| CAGR 2019-2025 | Percentage | XX% |
| CAGR 2026-2035 | Percentage | 5.20% |
| CAGR 2026-2035 - Market by Region | Asia Pacific | 6.0% |
| CAGR 2026-2035 - Market by Country | India | 6.9% |
| CAGR 2026-2035 - Market by Country | China | 5.6% |
| CAGR 2026-2035 - Market by Product | Cross Disciplinary | 5.7% |
| CAGR 2026-2035 - Market by End User | Life Sciences Companies | 5.9% |
| Market Share by Country 2025 | Japan | 4.4% |
It is projected that the increased demand for automation in laboratories would boost the adoption of electronic lab notebook. The benefits of electronic lab notebook such as process optimization, enhanced regulatory compliance, reduced labour costs, enhanced data quality, and faster delivery are some of the key drivers of the market growth.
A notebook for a digital lab is a computer program intended to replace notebooks for the paper laboratory. These also allow the direct integration of data from instruments to be stapled into a paper notebook, eliminating the custom of printing out data. The electronic lab notebook market can be segmented into product, license, delivery mode, and end-user.
Market Breakup by Product
Market Breakup by License
Market Breakup by Delivery Mode
Market Breakup by End User
Market Breakup by Region
Read more about this report - REQUEST FREE SAMPLE COPY IN PDF
The increasing robotics adoption and healthcare system automation has enabled reproducible and repeatable operations. The experimental results can now be set up, run, and evaluated in a shorter time. The increasing penetration of high-throughput systems has allowed experimental results to be analysed efficiently, which increases overall laboratory operations performance. These factors are projected to drive the growth of the electronic lab notebook market.


An electronic lab notebook is a customer-friendly interface that allows data retrieval search functionality and quick navigation inventory linked to laboratory notes. Manufacturing requires rigid systems that enable collaboration with complex iterative procedures and methods. Such systems need to be durable, secure, reproducible, and efficient, with minimal downtime. The emphasis is on improving service or product delivery speed and promoting regulatory scrutiny. Since most production processes are powered by processes, re-engineering them is simple. Virtual and electronic laboratories are needed for life science companies to create innovative products, improve quality, and operational efficiency. It is predicted that the above factors will drive the market for electronic lab notebook over the forecast period.
It is expected that North America will have a significant market share. Strict regulations for pharmaceutical companies have resulted in electronic lab notebook being increasingly implemented in this region. The key factors leading to the market growth are the involvement of major players in the industry and the release of new products. In the future, Asia Pacific is forecast to witness a rapid growth.
| CAGR 2026-2035 - Market by | Country |
| India | 6.9% |
| China | 5.6% |
| Canada | 4.9% |
| France | 4.1% |
| Italy | 3.6% |
| USA | XX% |
| UK | XX% |
| Germany | XX% |
| Japan | 3.6% |
| Australia | XX% |
| Saudi Arabia | XX% |
| Brazil | XX% |
| Mexico | XX% |
The report presents a detailed analysis of the following key players in the global electronic lab notebook market, looking into their capacity, market shares, and latest developments like capacity expansions, plant turnarounds, and mergers and acquisitions:
The EMR report gives an in-depth insight into the industry by providing a SWOT analysis as well as an analysis of Porter’s Five Forces model.


Upto 15% Off
USD
$2499 $2249
$3999 $3599
$4999 $4249
$5999 $5099


*While we strive to always give you current and accurate information, the numbers depicted on the website are indicative and may differ from the actual numbers in the main report. At Expert Market Research, we aim to bring you the latest insights and trends in the market. Using our analyses and forecasts, stakeholders can understand the market dynamics, navigate challenges, and capitalize on opportunities to make data-driven strategic decisions.*
Get in touch with us for a customized solution tailored to your unique requirements and save upto 35%!
In 2025, the global electronic lab notebook market attained a value of nearly USD 680.75 Million.
The market is projected to grow at a CAGR of 5.20% between 2026 and 2035.
The major drivers of the market are development of automated laboratories, growing demand for quick data delivery and enhanced data quality, growing research and development activities across the globe, rising awareness regarding the benefits offered by electronic lab notebooks, and strict regulatory compliances.
The key trends guiding the growth of the market include the growing technological advancements and the launch of improved and enhanced versions of electronic lab notebooks with smart features.
The major regions in the market are North America, Latin America, the Middle East and Africa, Europe, and the Asia Pacific.
Cross disciplinary and specific are the major products in the global electronic lab notebook market.
The leading license segments of the product in the market include proprietary and open electronic lab notebook licenses.
On-premise and web-hosted/cloud-based are the significant electronic lab notebook delivery modes in the market.
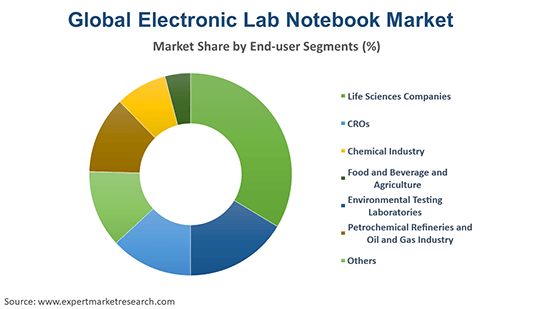
Life sciences companies, CROs, chemical industry, food and beverage and agriculture, environmental testing laboratories, and petrochemical refineries, and oil and gas industry are the significant end user segments of the product in the market.
The major players in the market are Thermo Fisher Scientific Inc., LabWare, Bruker, Abbott Laboratories, LabVantage Solutions Inc., LabLynx, Inc., and Benchling, Inc., among others.
The market is estimated to witness a healthy growth in the forecast period of 2026-2035 to reach USD 1130.17 Million by 2035.
Explore our key highlights of the report and gain a concise overview of key findings, trends, and actionable insights that will empower your strategic decisions.
| REPORT FEATURES | DETAILS |
| Base Year | 2025 |
| Historical Period | 2019-2025 |
| Forecast Period | 2026-2035 |
| Scope of the Report |
Historical and Forecast Trends, Industry Drivers and Constraints, Historical and Forecast Market Analysis by Segment:
|
| Breakup by Product |
|
| Breakup by License |
|
| Breakup by Delivery Mode |
|
| Breakup by End User |
|
| Breakup by Region |
|
| Market Dynamics |
|
| Competitive Landscape |
|
| Companies Covered |
|
| Report Price and Purchase Option | Explore our purchase options that are best suited to your resources and industry needs. |
| Delivery Format | Delivered as an attached PDF and Excel through email, with an option of receiving an editable PPT, according to the purchase option. |
Datasheet
One User
USD 2,499
USD 2,249
tax inclusive*
Single User License
One User
USD 3,999
USD 3,599
tax inclusive*
Five User License
Five User
USD 4,999
USD 4,249
tax inclusive*
Corporate License
Unlimited Users
USD 5,999
USD 5,099
tax inclusive*
*Please note that the prices mentioned below are starting prices for each bundle type. Kindly contact our team for further details.*
Flash Bundle
Small Business Bundle
Growth Bundle
Enterprise Bundle
*Please note that the prices mentioned below are starting prices for each bundle type. Kindly contact our team for further details.*
Flash Bundle
Number of Reports: 3
20%
tax inclusive*
Small Business Bundle
Number of Reports: 5
25%
tax inclusive*
Growth Bundle
Number of Reports: 8
30%
tax inclusive*
Enterprise Bundle
Number of Reports: 10
35%
tax inclusive*
How To Order

Select License Type
Choose the right license for your needs and access rights.

Click on ‘Buy Now’
Add the report to your cart with one click and proceed to register.

Select Mode of Payment
Choose a payment option for a secure checkout. You will be redirected accordingly.
Gain insights to stay ahead and seize opportunities.

Get insights & trends for a competitive edge.

Track prices with detailed trend reports.

Analyse trade data for supply chain insights.

Leverage cost reports for smart savings

Enhance supply chain with partnerships.

Connect For More Information
Our expert team of analysts will offer full support and resolve any queries regarding the report, before and after the purchase.
Our expert team of analysts will offer full support and resolve any queries regarding the report, before and after the purchase.
We employ meticulous research methods, blending advanced analytics and expert insights to deliver accurate, actionable industry intelligence, staying ahead of competitors.
Our skilled analysts offer unparalleled competitive advantage with detailed insights on current and emerging markets, ensuring your strategic edge.
We offer an in-depth yet simplified presentation of industry insights and analysis to meet your specific requirements effectively.


Share