

Consumer Insights
Uncover trends and behaviors shaping consumer choices today
Procurement Insights
Optimize your sourcing strategy with key market data
Industry Stats
Stay ahead with the latest trends and market analysis.
Trending Now


The global dairy market attained a value of approximately USD 561.66 Billion in 2024. The market is further expected to grow in the forecast period of 2025-2034 at a CAGR of 3.60%, reaching a value of around USD 799.97 Billion by 2034.
Base Year
Historical Year
Forecast Year


Value in USD Billion
2025-2034
Dairy Market Outlook
*this image is indicative*
| Global Dairy Market Report Summary | Description | Value |
| Base Year | USD Billion | 2023 |
| Historical Period | USD Billion | 2018-2024 |
| Forecast Period | USD Billion | 2025-2034 |
| Market Size 2024 | USD Billion | 542.14 |
| Market Size 2034 | USD Billion | 745.33 |
| CAGR 2018-2024 | Percentage | XX% |
| CAGR 2025-2034 | Percentage | 3.6% |
| CAGR 2025-2034 - Market by Region | Asia Pacific | 4.2% |
| CAGR 2025-2034 - Market by Country | India | 4.6% |
| CAGR 2025-2034 - Market by Country | China | 4.4% |
| CAGR 2025-2034 - Market by Product | Fluid/UHT/Flavoured Milk | 4.1% |
| Market Share by Country 2023 | France | 4.5% |
Read more about this report - REQUEST FREE SAMPLE COPY IN PDF
Dairy refers to milk and products derived from milk such as butter, cheese, yogurt, or cream. Dairy products are a key component of many diets globally due to their nutritional value. They contain calcium, proteins, vitamin A, vitamin B, vitamin B12, riboflavin and other nutrients and minerals, and are known for strengthening bones. Most commonly, dairy milk is obtained from cows, goats, camels, and sheep.


Dairy farming involves the breeding and raising of dairy animals, primarily cows, for milk production. Pasteurisation, homogenisation, fermentation, and ageing are some of the processes used to produce different dairy products, thus, boosting the dairy market demand.
Dairy products are integral to many cuisines and culinary traditions around the world. In some cultures, dairy animals and products hold religious or symbolic significance. The dairy sector is a major part of the agricultural economy in many countries. It provides livelihoods for millions of people worldwide, from farming to processing and retail.
According to FAO, Asia saw a 2.3% increase in milk production in 2023, the highest growth globally. Central America and the Caribbean experienced a 1.3% rise, indicating significant regional growth. South America's milk production grew by 0.7%, showing moderate improvement. Europe saw a modest 0.5% increase, reflecting stable dairy market demand growth. Oceania's milk production rose by 0.4%, demonstrating a slight uptick. North America's milk production increased by 0.3%, indicating minimal growth.
Regarding global dairy exports, skimmed milk powder (SMP) exports increased by 3.7% in 2023, leading to growth, while cheese exports saw a marginal 0.4% rise.
Dairy market dynamics and trends are being boosted as the European Union remains the top cheese exporter, consistently surpassing 1,500 thousand tons annually from 2019 to the 2023 forecast. The United States maintained a steady export volume of 300 to 400 thousand tons over the same period, while New Zealand's exports ranged between 300 to 400 thousand tons annually. Belarus consistently exported between 200 to 300 thousand tons each year.
FAO forecasts India's dairy production to increase from 226,090 to 231,740 thousand tons, with minimal imports. Indonesia shows a steady production rise from 1,600 to 1,611 thousand tons, with imports increasing slightly from 3,775 to 4,206 thousand tons.
As per dairy industry analysis, between 2020 and 2023, the Australian dairy industry showcased resilience and growth in key metrics. The value of farm production surged from USD 4,829 million to a projected USD 6,082 million, reflecting a strong CAGR of 8.0% for the 2020s. Per capita consumption increased from 319 litres to 327 litres, indicating a steady rise in domestic demand with a CAGR of 0.8%. Export value grew from USD 3,378 million to an estimated USD 3,707 million, demonstrating a healthy CAGR of 3.2% and a robust international market presence. The export share of production also slightly increased from 29% to 30%, highlighting the sector's growing export orientation according to ABS.
The growth of the dairy market features intense competition among key players from various regions, each striving for dominance through diverse strategies. The European Union, the United States, and New Zealand lead in cheese exports, leveraging advanced production technologies and established supply chains. Emerging markets like India and China are rapidly increasing production capacities to meet rising domestic demand and enter international markets.
Countries such as Saudi Arabia and Turkey are enhancing their export capabilities. Price volatility, shifting consumer preferences towards plant-based alternatives, and stringent regulatory standards add to the competitive landscape. The dairy market opportunities will be increasingly accelerated by focusing on innovation, sustainability, and branding to gain an edge.
Read more about this report - REQUEST FREE SAMPLE COPY IN PDF
“Global Dairy Market Report and Forecast 2024-2032” offers a detailed analysis of the market based on the following segments:
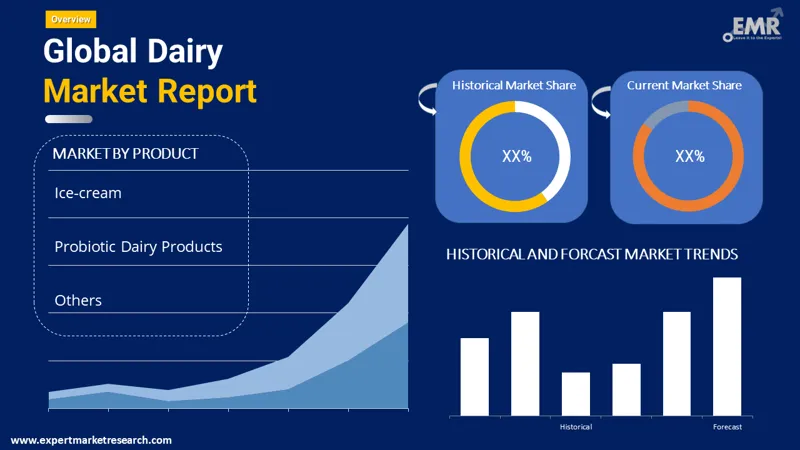
Market Breakup by Product
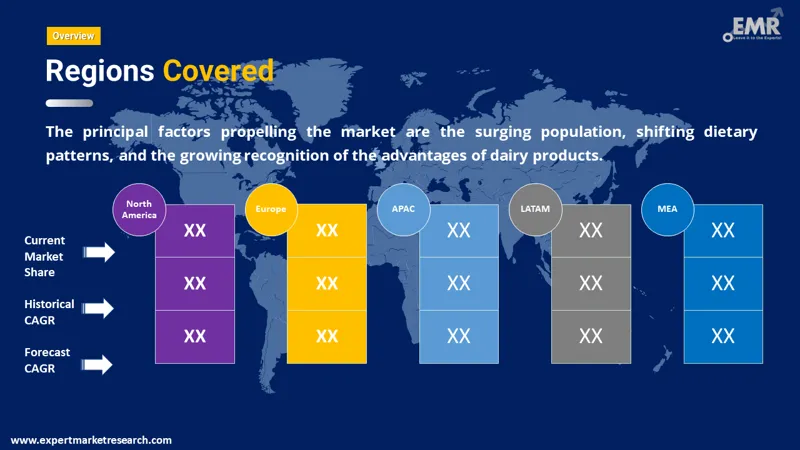
Market Breakup by Region
Globally, fluid, UHT, and flavoured milk represent a significant portion of the dairy market share. Drinking milk daily is a common tradition in households worldwide, especially for children, often consumed plain, flavoured, or with cereals. UHT milk offers the advantage of a long shelf life and non-refrigerated storage, making it ideal for regions lacking consistent refrigeration or emergency food supplies.
Flavoured milk combines the nutritional benefits of milk with a sweetened, flavoured taste, appealing to those who prefer a more enjoyable option.
Cheese holds a significant share of the global dairy market enhances trends of dairy market and is widely used in cooking, especially in pasta, snacks, sandwiches, salads, and pizzas. Soft cheeses, milk, and yoghurt are favoured by health-conscious consumers. Dairy ice cream is extremely popular, capturing a substantial market share due to its delicious taste and nutritional content.
The Asia Pacific region dominates the dairy market in terms of revenue due to high milk production and consumption, growing populations, and rising disposable incomes. Major milk producers include India and China, with other key markets being Japan, Malaysia, Indonesia, and the Philippines. Increasing awareness of dairy’s nutritional benefits, especially its protein and calcium content, is driving higher consumption.
The influence of Western dietary habits has also boosted dairy consumption, which was not traditionally common in many Asian diets. Advances in cold chain logistics have facilitated the distribution of dairy products, even to remote areas, while the rise of online grocery shopping has made these products more accessible to consumers, thus, boosting the demand of the dairy market.
Europe also accounts for a considerable share of the global market, particularly for cheeses and butter. The European Union is a significant producer of cow milk, along with over 300 types of cheeses and other dairy products. In North America, the dairy market value is substantially growing, with increase in production and consumption levels. Historically, there has been a surplus in dairy production with extensive exports to regions with relatively lower production.
| CAGR 2025-2034 - Market by | Country |
| India | 4.6% |
| China | 4.4% |
| Mexico | 4.1% |
| Brazil | 4.0% |
| Canada | 3.5% |
| USA | XX% |
| Germany | XX% |
| France | 3.1% |
| Italy | XX% |
| Japan | XX% |
| Australia | XX% |
| Saudi Arabia | XX% |
| UK | 2.9% |
Read more about this report - REQUEST FREE SAMPLE COPY IN PDF
The demand in the dairy market is driven by the rising consumer awareness of the health benefits of dairy products and the expanding range of available products. The versatile range of dairy products encourages their widespread consumption, including through direct products such as milk, yoghurt, and ice cream, as well as in cooking, in the form of butter and cheese. The growing trend of organic products is influencing the dairy demand, as more consumers seek organic dairy products that do not have any chemical components. An increase in distribution channels is further augmenting the market for dairy, with consumers able to access dairy products from local convenience stores, larger chain supermarkets/hypermarkets, and online retailers.
Danone S.A. was founded in 1919 and has its headquarters in Paris, France. It is a multinational French food company that delivers healthy products like plant-based foods, medical nutrition, dairy products, bottled water, and early-life nutrition.
Arla Foods Amba is a Danish-Swedish dairy company which was established in 2000 and has its headquarters in Aarhus, Denmark. It is a farmer-owned company that produces most of the milk they supply. Their objective is to contribute to a sustainable future by providing naturally built solutions.
Nestlé S.A., founded in 1866, has its headquarters in Vevey, Switzerland. It is among the largest food and beverage companies in the world. With a company motto of ‘Good Food, Good Life’, they believe in discovering the power of food and then producing and supplying it to the world to improve the quality of everyone’s life.
*Please note that this is only a partial list; the complete list of key players is available in the full report. Additionally, the list of key players can be customized to better suit your needs.*
Other market players include Royal FrieslandCampina N.V., Fonterra Co-operative Group Limited, Dairy Farmers of America, Inc., Lactalis Group, Saputo Inc., China Mengniu Dairy Company Limited, and Meiji Holdings Company, Ltd, among others.
*While we strive to always give you current and accurate information, the numbers depicted on the website are indicative and may differ from the actual numbers in the main report. At Expert Market Research, we aim to bring you the latest insights and trends in the market. Using our analyses and forecasts, stakeholders can understand the market dynamics, navigate challenges, and capitalize on opportunities to make data-driven strategic decisions.*
Get in touch with us for a customized solution tailored to your unique requirements and save upto 35%!
In 2024, the global dairy market attained a value of USD 561.66 Billion.
The global dairy market is expected to grow at a CAGR of 3.60% between 2025 and 2034.
The market is estimated to reach USD 799.97 Billion by 2034.
Increase in population, changing dietary habits, and awareness of benefits of dairy products are the major market drivers.
The key dairy market trends include development of new dairy products, new tastes and preferences of consumers, and growing usage by end-user sectors.
The market is broken down into North America, Europe, Asia Pacific, Latin America, the Middle East, and Africa.
Dairy milk is mostly obtained from lactating mammals such as cows, goats, camels, and sheep.
The various products in the market for dairy are fluid/UHT/flavoured milk, cream, butter, ghee, anhydrous milk fat (AMF), skimmed milk powder/non-fat dry milk, whole milk powder, whey protein (powder and concentrate), Indian cheese (paneer), lactose, casein, cheese, yoghurt, ice-cream, and probiotic dairy products.
The market key players are Danone S.A., Royal FrieslandCampina N.V., Arla Foods amba, Nestlé S.A., Fonterra Co-operative Group Limited, Dairy Farmers of America, Inc., Lactalis Group, Saputo Inc., China Mengniu Dairy Company Limited, and Meiji Holdings Company, Ltd, among others.
Explore our key highlights of the report and gain a concise overview of key findings, trends, and actionable insights that will empower your strategic decisions.
| REPORT FEATURES | DETAILS |
| Base Year | 2024 |
| Historical Period | 2018-2024 |
| Forecast Period | 2025-2034 |
| Scope of the Report |
Historical and Forecast Trends, Industry Drivers and Constraints, Historical and Forecast Market Analysis by Segment:
|
| Breakup by Product |
|
| Breakup by Region |
|
| Market Dynamics |
|
| Competitive Landscape |
|
| Companies Covered |
|
Datasheet
One User
USD 2,499
USD 2,249
tax inclusive*
Single User License
One User
USD 3,999
USD 3,599
tax inclusive*
Five User License
Five User
USD 4,999
USD 4,249
tax inclusive*
Corporate License
Unlimited Users
USD 5,999
USD 5,099
tax inclusive*
*Please note that the prices mentioned below are starting prices for each bundle type. Kindly contact our team for further details.*
Flash Bundle
Small Business Bundle
Growth Bundle
Enterprise Bundle
*Please note that the prices mentioned below are starting prices for each bundle type. Kindly contact our team for further details.*
Flash Bundle
Number of Reports: 3
20%
tax inclusive*
Small Business Bundle
Number of Reports: 5
25%
tax inclusive*
Growth Bundle
Number of Reports: 8
30%
tax inclusive*
Enterprise Bundle
Number of Reports: 10
35%
tax inclusive*
How To Order
Our step-by-step guide will help you select, purchase, and access your reports swiftly, ensuring you get the information that drives your decisions, right when you need it.

Select License Type
Choose the right license for your needs and access rights.

Click on ‘Buy Now’
Add the report to your cart with one click and proceed to register.

Select Mode of Payment
Choose a payment option for a secure checkout. You will be redirected accordingly.
Track prices with detailed trend reports.

Analyse trade data for supply chain insights.

Leverage cost reports for smart savings

Enhance supply chain with partnerships.

Gain insights to stay ahead and seize opportunities.

Get insights & trends for a competitive edge.

Track prices with detailed trend reports.
Analyse trade data for supply chain insights.
Leverage cost reports for smart savings
Enhance supply chain with partnerships.
Gain insights to stay ahead and seize opportunities.
Get insights & trends for a competitive edge.
Track prices with detailed trend reports.
Analyse trade data for supply chain insights.
Connect For More Information
Our expert team of analysts will offer full support and resolve any queries regarding the report, before and after the purchase.
Our expert team of analysts will offer full support and resolve any queries regarding the report, before and after the purchase.
We employ meticulous research methods, blending advanced analytics and expert insights to deliver accurate, actionable industry intelligence, staying ahead of competitors.
Our skilled analysts offer unparalleled competitive advantage with detailed insights on current and emerging markets, ensuring your strategic edge.
We offer an in-depth yet simplified presentation of industry insights and analysis to meet your specific requirements effectively.
Australia
63 Fiona Drive, Tamworth, NSW
+61-448-061-727
India
C130 Sector 2 Noida, Uttar Pradesh 201301
+91-723-689-1189
Philippines
40th Floor, PBCom Tower, 6795 Ayala Avenue Cor V.A Rufino St. Makati City,1226.
+63-287-899-028, +63-967-048-3306
United Kingdom
6 Gardner Place, Becketts Close, Feltham TW14 0BX, Greater London
+44-753-713-2163
United States
30 North Gould Street, Sheridan, WY 82801
+1-415-325-5166
Vietnam
193/26/4 St.no.6, Ward Binh Hung Hoa, Binh Tan District, Ho Chi Minh City
+84-865-399-124
United States (Head Office)
30 North Gould Street, Sheridan, WY 82801
+1-415-325-5166
Australia
63 Fiona Drive, Tamworth, NSW
+61-448-061-727
India
C130 Sector 2 Noida, Uttar Pradesh 201301
+91-723-689-1189
Philippines
40th Floor, PBCom Tower, 6795 Ayala Avenue Cor V.A Rufino St. Makati City, 1226.
+63-287-899-028, +63-967-048-3306
United Kingdom
6 Gardner Place, Becketts Close, Feltham TW14 0BX, Greater London
+44-753-713-2163
Vietnam
193/26/4 St.no.6, Ward Binh Hung Hoa, Binh Tan District, Ho Chi Minh City
+84-865-399-124


Share