

Consumer Insights
Uncover trends and behaviors shaping consumer choices today
Procurement Insights
Optimize your sourcing strategy with key market data
Industry Stats
Stay ahead with the latest trends and market analysis.

The global cryogenic valve market size attained a value of USD 4.18 Billion in 2025. The market is further expected to grow at a CAGR of 6.00% between 2026 and 2035, to reach a value of USD 7.49 Billion by 2035.
Base Year
Historical Period
Forecast Period
Compound Annual Growth Rate
6%
Value in USD Billion
2026-2035
*this image is indicative*
A cryogenic valve refers to a device which controls the flow of cryogenic gases, ensuring their safety and security. As Cryogenic gases are very sensitive, cryogenic valves are essential for the efficient transportation and storage of these gases thereby, reducing the chances of serious damage to the environment. Cryogenic valves are different from standard valves, owing to their ability to function in extreme low temperatures and in both in low- and high-pressure conditions.
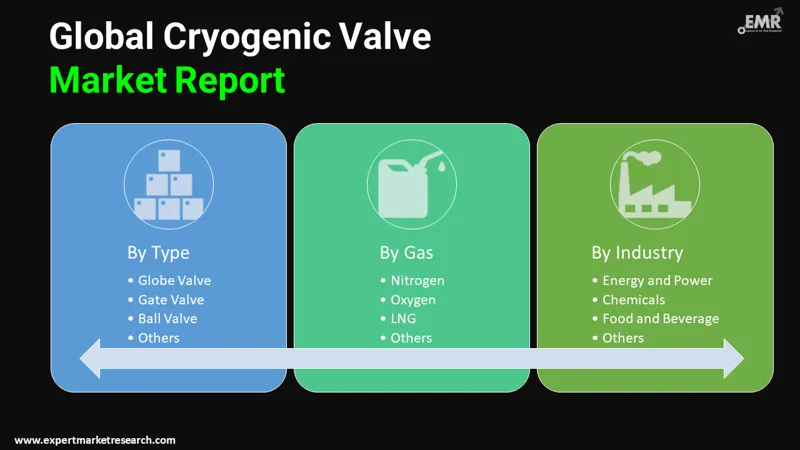
The EMR’s report titled “Cryogenic Valve Market Report and Forecast 2026-2035 offers a detailed analysis of the market based on the following segments:
Market Breakup by Type
Market Breakup by Gas
Market Breakup by End Use
Market Breakup by Application
Market Breakup by Region


The LNG segment, based on gas, accounts for a healthy share of the cryogenic valve market. This can be attributed to the increasing application of LNG as a fuel in the residential and industrial sectors. LNG is used in cooking and heating homes, due to which it is witnessing a heightened demand in the residential sector. Commercial uses of LNG includes fertilisers, paints, and medicines, among others. Cryogenic valves are being deployed in liquefaction plants, gas tankers, and receiving LNG tank terminals, leading to a heightened growth of this segment. Moreover, LNG gas use of cryogenic valves is anticipated to be aided by the rapid transition from using conventional diesel to LNG as a fuel for ships, due to the lower levels of pollution generated by LNG.
Based on end use, the energy and power segment accounts for a significant share in the cryogenic valve market. The globally increasing demand for electricity is bolstering the demand for oil and gas to meet the fuel requirements. Hence, cryogenic valves are witnessing a heightened deployment in oil and gas operations. Over the forecast period, the anticipated increase in growth of power plants, along with advancements in electricity distribution systems, is likely to propel the demand for cryogenic valves for efficient transportation of sensitive oils and gases. Moreover, the increasing drilling activities and growing advancements in oilfield explorations are further aiding the growth of the energy and power end uses of cryogenic valves.
The comprehensive EMR report provides an in-depth assessment of the market based on the Porter's five forces model along with giving a SWOT analysis. The report gives a detailed analysis of the key players in the global cryogenic valve market, covering their competitive landscape and latest developments like mergers, acquisitions, investments and expansion plans.
Flowserve Corporation is a leading machine industry company which provides efficient fluid motion and control products and services. The vast product portfolio of the company includes pumps, seals, valves, actuation and instrument, energy recovery device, and decoking system, among others. It was found in 1997 and is currently headquartered in Texas, United States.
HEROSE GMBH is a prominent manufacturer of valves for industrial use. The company also provides safety services across the globe for the handling of technical gases, steams, and liquids. HEROSE supplies technical equipment for cryogenic technology, LNG applications, industrial applications, and oil-cooled transformers, among others. Founded in 1873, the company is currently based out of Schleswig-Holstein, Germany.
Emerson Electric Co is a leading manufacturing company which provides engineering services for industrial, commercial, and consumer markets. The product portfolio of this company includes digital valve controllers, mount transmitters, flow meters, health analysers, and pressure regulators, among others. The company was established in 1890 and is currently headquartered in Missouri in the United States.
*Please note that this is only a partial list; the complete list of key players is available in the full report. Additionally, the list of key players can be customized to better suit your needs.*
Other market players include Samson Controls Inc., Cryofab, Inc, Habonim Industrial Valves & Actuators Ltd., and Powell Valves, among others.


Upto 15% Off
USD
$2499 $2249
$3999 $3599
$4999 $4249
$5999 $5099


*While we strive to always give you current and accurate information, the numbers depicted on the website are indicative and may differ from the actual numbers in the main report. At Expert Market Research, we aim to bring you the latest insights and trends in the market. Using our analyses and forecasts, stakeholders can understand the market dynamics, navigate challenges, and capitalize on opportunities to make data-driven strategic decisions.*
Get in touch with us for a customized solution tailored to your unique requirements and save upto 35%!
The market reached a value of USD 4.18 Billion in 2025.
The market is estimated to grow at a CAGR of 6.00% between 2026 and 2035.
The market is estimated to witness a healthy growth in the forecast period of 2026-2035 to reach a value of USD 7.49 Billion by 2035.
The increasing applications of cryogenic valves in various sectors, improving safety standards of transportation, increasing demand for LNG, and thriving energy and power sector are the major drivers of the market.
The key trends in the market include the stringent safety regulations of various government for the industrial sector and technological advancements in valve technology.
Globe valve, gate valve, check valve, and ball valve, among others, are the different types of cryogenic valves in the market.
Nitrogen, oxygen, and LNG, among others, are the various gases in the market.
The different applications in the market are tanks and cold boxes, liquefiers, transfer lines, and manifolds and gas trains, among others.
The material usually used in cryogenic valves is stainless steel.
Flowserve Corporation, HEROSE GMBH, Emerson Electric Co, Samson Controls Inc., Cryofab, Inc, Habonim Industrial Valves & Actuators Ltd., and Powell Valves, among others, are the key players in the cryogenic valve market, according to the report.
Explore our key highlights of the report and gain a concise overview of key findings, trends, and actionable insights that will empower your strategic decisions.
| REPORT FEATURES | DETAILS |
| Base Year | 2025 |
| Historical Period | 2019-2025 |
| Forecast Period | 2026-2035 |
| Scope of the Report |
Historical and Forecast Trends, Industry Drivers and Constraints, Historical and Forecast Market Analysis by Segment:
|
| Breakup by Type |
|
| Breakup by Gas |
|
| Breakup by End Use |
|
| Breakup by Application |
|
| Breakup by Region |
|
| Market Dynamics |
|
| Competitive Landscape |
|
| Companies Covered |
|
| Report Price and Purchase Option | Explore our purchase options that are best suited to your resources and industry needs. |
| Delivery Format | Delivered as an attached PDF and Excel through email, with an option of receiving an editable PPT, according to the purchase option. |
Datasheet
One User
USD 2,499
USD 2,249
tax inclusive*
Single User License
One User
USD 3,999
USD 3,599
tax inclusive*
Five User License
Five User
USD 4,999
USD 4,249
tax inclusive*
Corporate License
Unlimited Users
USD 5,999
USD 5,099
tax inclusive*
*Please note that the prices mentioned below are starting prices for each bundle type. Kindly contact our team for further details.*
Flash Bundle
Small Business Bundle
Growth Bundle
Enterprise Bundle
*Please note that the prices mentioned below are starting prices for each bundle type. Kindly contact our team for further details.*
Flash Bundle
Number of Reports: 3
20%
tax inclusive*
Small Business Bundle
Number of Reports: 5
25%
tax inclusive*
Growth Bundle
Number of Reports: 8
30%
tax inclusive*
Enterprise Bundle
Number of Reports: 10
35%
tax inclusive*
How To Order

Select License Type
Choose the right license for your needs and access rights.

Click on ‘Buy Now’
Add the report to your cart with one click and proceed to register.

Select Mode of Payment
Choose a payment option for a secure checkout. You will be redirected accordingly.
Gain insights to stay ahead and seize opportunities.

Get insights & trends for a competitive edge.

Track prices with detailed trend reports.

Analyse trade data for supply chain insights.

Leverage cost reports for smart savings

Enhance supply chain with partnerships.

Connect For More Information
Our expert team of analysts will offer full support and resolve any queries regarding the report, before and after the purchase.
Our expert team of analysts will offer full support and resolve any queries regarding the report, before and after the purchase.
We employ meticulous research methods, blending advanced analytics and expert insights to deliver accurate, actionable industry intelligence, staying ahead of competitors.
Our skilled analysts offer unparalleled competitive advantage with detailed insights on current and emerging markets, ensuring your strategic edge.
We offer an in-depth yet simplified presentation of industry insights and analysis to meet your specific requirements effectively.


Share