

Consumer Insights
Uncover trends and behaviors shaping consumer choices today
Procurement Insights
Optimize your sourcing strategy with key market data
Industry Stats
Stay ahead with the latest trends and market analysis.

The global connected living room market, valued at USD 62.83 Billion in 2025, has seen substantial growth, driven by the increasing consumer demand for seamless connectivity and integrated entertainment experiences within the home environment. The market is forecasted to grow at a CAGR of 8.70% from 2026 to 2035, potentially reaching USD 144.70 Billion by 2035, owing to the increasing popularity of gaming consoles, smart TVs, and growing concerns about home security and privacy.
Base Year
Historical Period
Forecast Period
According to the Ministry of Industry and Information Technology, by June 2023, China had 2.6 million active apps, fostering a robust ecosystem for smart devices. This wide range of apps boosts demand for connected living room technologies, encouraging consumers to adopt smart TVs and streaming devices that integrate seamlessly with various applications for a richer entertainment experience.
As reported by the ABS, Australian households average 2.40 online subscription services, highlighting a shift towards digital content consumption. This trend drives the connected living room market as consumers look for smart TVs and streaming devices to efficiently manage multiple subscriptions, improving their home entertainment experience and boosting sales of connected devices.
Industry reports indicate that India's gaming sector is expected to grow by 20% by FY25, reaching INR 231 billion. This growth is increasing the demand for gaming consoles and smart TVs in connected living rooms, as consumers seek immersive gaming experiences and integrated solutions that combine gaming with other forms of entertainment.
Compound Annual Growth Rate
8.7%
Value in USD Billion
2026-2035
*this image is indicative*
The connected living room market provides various advantages, including wider entertainment options through seamless access to streaming services, gaming, and media. It offers increased convenience by enabling control of lighting, temperature, and entertainment via a single platform. AI-driven personalised recommendations cater to individual tastes, while voice assistants like Alexa and Google Assistant offer hands-free control. The International Trade Administration reported a USD 159.3B global video game market in 2021, with 2.7 billion gamers worldwide.
Integration with home automation systems enhances comfort and control. Additionally, faster internet and advanced streaming technologies deliver superior viewing quality with reduced buffering. Cloud gaming, multi-device connectivity, and improved accessibility for people with disabilities further elevate the user experience. Energy-efficient technologies help reduce electricity use, while real-time updates provide valuable information, such as weather forecasts and news.
Read more about this report - REQUEST FREE SAMPLE COPY IN PDF
Growth of smart devices, increasing demand for streaming services, and integration of AI and voice control are driving the growth of the connected living room market.
The rise of smart devices is a key driver in the market, as consumers demand seamless connectivity and integrated experiences. Smart TVs, speakers, and home automation systems improve user convenience, leading to higher adoption rates. In October 2024, Amazon launched new Echo Show models with better display features and enhanced smart home integration, reflecting growing consumer interest in connected devices.
Increasing demand for streaming services is boosting the market for connected living room. Consumers are seeking high-quality content accessible through various devices, driving growth in smart TVs and streaming technologies. In November 2024, Netflix expanded its content library, encouraging more consumers to invest in smart TVs for superior viewing experiences.
AI and voice control integration are revolutionising the market by allowing seamless device control via voice commands. These technologies enhance user convenience and accessibility. In September 2024, Google launched new AI-powered features for its Nest devices, improving voice recognition and user interaction within connected homes.
Virtual and augmented reality (VR and AR) technologies are reshaping the connected living room market by offering immersive entertainment experiences. Consumers are investing in compatible devices to enhance their home entertainment. In December 2024, Meta released a new VR headset, signalling a growing interest in VR within connected living rooms, providing innovative content engagement methods.
Read more about this report - REQUEST FREE SAMPLE COPY IN PDF
The EMR’s report titled “Global Connected Living Room Market Report and Forecast 2026-2035” offers a detailed analysis of the market based on the following segments:
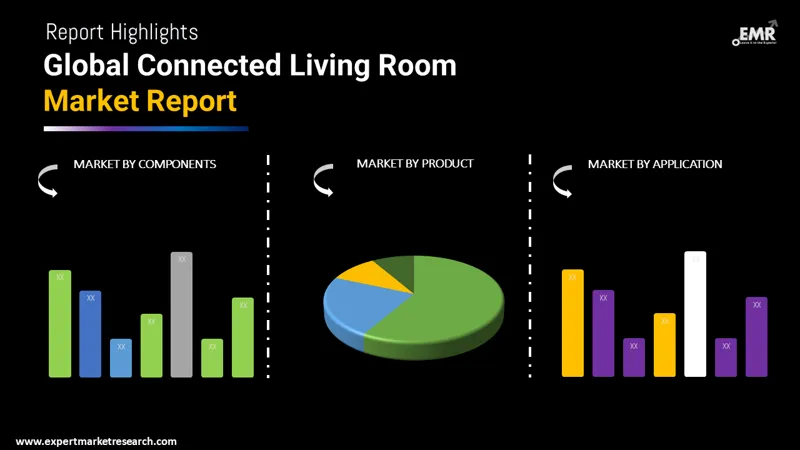
Market Breakup by Components
Market Breakup by Product Type
Market Breakup by Application
Market Breakup by Region


According to the connected living room market analysis, video streaming dominates by offering on-demand access to a wide range of content, allowing users to watch shows and movies at their convenience. This boosts user engagement and drives the adoption of smart TVs and streaming devices. In November 2024, Netflix introduced an interactive series allowing viewers to choose their storyline, enhancing engagement, and encouraging subscriptions and usage of smart TVs for an immersive experience.
Audio streaming provides immediate access to music and podcasts, promoting convenience and personalised listening. This encourages the adoption of smart speakers and integrated audio systems in connected living rooms. In March 2024, Spotify launched its HiFi streaming service with lossless sound, prompting users to invest in high-quality audio systems.
The connected living room market growth is further driven by gaming, with immersive experiences through advanced graphics and multiplayer capabilities. Cloud gaming services increase accessibility, driving demand for gaming consoles and smart TVs. In September 2024, NVIDIA launched its GeForce NOW RTX 4080 service, offering high-performance cloud gaming, and encouraging the use of compatible devices in connected living rooms.
The connected living room market key players are recognised for their innovative contributions to electronics, electrical engineering, and information technology. These companies operate across multiple industries, offering a wide range of products including semiconductors, storage devices, energy-efficient technologies, and consumer electronics. They are known for their commitment to sustainability, having pioneered eco-friendly solutions such as advanced energy storage systems and low-carbon technologies.
Founded in 1910 and headquartered in Tokyo, Japan, Hitachi is a global leader across various industries, including IT, social innovation, and energy systems. The company excels in providing advanced technology solutions, especially in infrastructure, healthcare, and industrial sectors, contributing to technological advancement worldwide.
Established in 1875 and based in Tokyo, Japan, Toshiba is known for its innovations in electronics, electrical engineering, and IT services. The company offers a wide range of products, including semiconductors, storage devices, and energy-efficient technologies, focusing on sustainable solutions to meet diverse industry needs.
Headquartered in Seoul, South Korea, and founded in 1958, LG Electronics is a global leader in consumer electronics, home appliances, and mobile devices. Renowned for its innovative smart technology, energy-efficient appliances, and high-quality displays, the company delivers a variety of products across multiple industries.
Founded in 1918 and based in Osaka, Japan, Panasonic Corporation is a multinational electronics company. It is known for its diverse products, including consumer electronics, automotive systems, and industrial solutions, with a focus on sustainable development and cutting-edge technology to improve the quality of life globally.
*Please note that this is only a partial list; the complete list of key players is available in the full report. Additionally, the list of key players can be customized to better suit your needs.*
Other key players in the connected living room market report include Google Inc. and Amazon Inc., among others.


Upto 15% Off
USD
$2499 $2249
$3999 $3599
$4999 $4249
$5999 $5099


*While we strive to always give you current and accurate information, the numbers depicted on the website are indicative and may differ from the actual numbers in the main report. At Expert Market Research, we aim to bring you the latest insights and trends in the market. Using our analyses and forecasts, stakeholders can understand the market dynamics, navigate challenges, and capitalize on opportunities to make data-driven strategic decisions.*
Get in touch with us for a customized solution tailored to your unique requirements and save upto 35%!
In 2025, the connected living room market reached an approximate value of USD 62.83 Billion.
The market is assessed to grow at a CAGR of 8.70% between 2026 and 2035.
The major drivers of the industry, such as rising disposable incomes, increasing population, and government initiatives in the industry, are expected to aid the industry growth.
The rising preference for second screen devices and the subsequent growth in the product’s demand among the consumers are expected to be the key trends guiding the growth of the market.
North America, Latin America, Europe, the Middle East and Africa, and the Asia Pacific are the leading regions in the market.
The major component segments in the market are sensors, thermostats, cameras, data storage system, and communication device, among others.
The market, based on its product type, can be categorised as consumer computing, TV system, gaming consoles, security system, smart plugs, and wireless speakers, among others.
The major application segments in the market include video streaming, audio streaming, and gaming, among others.
The leading players in the market are Hitachi, Ltd., Toshiba Corporation, LG Electronic Inc., Panasonic Corporation, Google Inc., Apple Inc., Amazon Inc., Others.
The market is estimated to witness healthy growth in the forecast period of 2026-2035 to reach a value of around USD 144.70 Billion by 2035.
Explore our key highlights of the report and gain a concise overview of key findings, trends, and actionable insights that will empower your strategic decisions.
| REPORT FEATURES | DETAILS |
| Base Year | 2025 |
| Historical Period | 2019-2025 |
| Forecast Period | 2026-2035 |
| Scope of the Report |
Historical and Forecast Trends, Industry Drivers and Constraints, Historical and Forecast Market Analysis by Segment:
|
| Breakup by Components |
|
| Breakup by Product Type |
|
| Breakup by Application |
|
| Breakup by Region |
|
| Market Dynamics |
|
| Competitive Landscape |
|
| Companies Covered |
|
| Report Price and Purchase Option | Explore our purchase options that are best suited to your resources and industry needs. |
| Delivery Format | Delivered as an attached PDF and Excel through email, with an option of receiving an editable PPT, according to the purchase option. |
Datasheet
One User
USD 2,499
USD 2,249
tax inclusive*
Single User License
One User
USD 3,999
USD 3,599
tax inclusive*
Five User License
Five User
USD 4,999
USD 4,249
tax inclusive*
Corporate License
Unlimited Users
USD 5,999
USD 5,099
tax inclusive*
*Please note that the prices mentioned below are starting prices for each bundle type. Kindly contact our team for further details.*
Flash Bundle
Small Business Bundle
Growth Bundle
Enterprise Bundle
*Please note that the prices mentioned below are starting prices for each bundle type. Kindly contact our team for further details.*
Flash Bundle
Number of Reports: 3
20%
tax inclusive*
Small Business Bundle
Number of Reports: 5
25%
tax inclusive*
Growth Bundle
Number of Reports: 8
30%
tax inclusive*
Enterprise Bundle
Number of Reports: 10
35%
tax inclusive*
How To Order

Select License Type
Choose the right license for your needs and access rights.

Click on ‘Buy Now’
Add the report to your cart with one click and proceed to register.

Select Mode of Payment
Choose a payment option for a secure checkout. You will be redirected accordingly.
Gain insights to stay ahead and seize opportunities.

Get insights & trends for a competitive edge.

Track prices with detailed trend reports.

Analyse trade data for supply chain insights.

Leverage cost reports for smart savings

Enhance supply chain with partnerships.

Connect For More Information
Our expert team of analysts will offer full support and resolve any queries regarding the report, before and after the purchase.
Our expert team of analysts will offer full support and resolve any queries regarding the report, before and after the purchase.
We employ meticulous research methods, blending advanced analytics and expert insights to deliver accurate, actionable industry intelligence, staying ahead of competitors.
Our skilled analysts offer unparalleled competitive advantage with detailed insights on current and emerging markets, ensuring your strategic edge.
We offer an in-depth yet simplified presentation of industry insights and analysis to meet your specific requirements effectively.


Share