

Consumer Insights
Uncover trends and behaviors shaping consumer choices today
Procurement Insights
Optimize your sourcing strategy with key market data
Industry Stats
Stay ahead with the latest trends and market analysis.

The global condiments market attained a value of USD 30.90 Billion in 2025. The industry is expected to grow at a CAGR of 4.50% during the forecast period of 2026-2035 to attain a value of USD 47.99 Billion by 2035.
Base Year
Historical Period
Forecast Period
According to the USDA, Australia’s food, drink, and grocery sectors contributed 33% to its manufacturing in 2021, generating AUD 116 billion. The demand for condiments is rising, driven by the growing popularity of ethnic and exotic flavours, as well as the increasing demand for ready-to-use packaged sauces and dressings.
McDonald’s operates 2,566 restaurants across Latin America as of 2023. The chain has expanded its menu to include diverse flavours, such as new burger options and dipping sauces for Chicken McNuggets. This innovation is driving the usage of condiments, as customers seek to enhance their meals with a variety of flavours.
The USDA reports that the UK’s demand for plant-based meat and dairy doubled to USD 1.6 billion by 2020. As plant-based options gain popularity, consumers are increasingly seeking condiments such as sauces, dressings, and dips to complement their meals, thus boosting demand for a wide variety of condiments.
Compound Annual Growth Rate
4.5%
Value in USD Billion
2026-2035
*this image is indicative*
| Global Condiments Market Report Summary | Description | Value |
| Base Year | USD Billion | 2025 |
| Historical Period | USD Billion | 2019-2025 |
| Forecast Period | USD Billion | 2026-2035 |
| Market Size 2025 | USD Billion | 30.90 |
| Market Size 2035 | USD Billion | 47.99 |
| CAGR 2019-2025 | Percentage | XX% |
| CAGR 2026-2035 | Percentage | 4.50% |
| CAGR 2026-2035 - Market by Region | Asia Pacific | 5.2% |
| CAGR 2026-2035 - Market by Country | India | 6.0% |
| CAGR 2026-2035 - Market by Country | China | 5.1% |
| CAGR 2026-2035 - Market by Product | Table Sauces | 5.0% |
| CAGR 2026-2035 - Market by Distribution Channel | Online Stores | 6.8% |
| Market Share by Country 2025 | Germany | 4.4% |
The growing health consciousness and shifting preferences among consumers have boosted the demand for clean-labelled, gluten-free, and organic condiments. To cater to the increasing demand, vendors are increasingly focusing on manufacturing condiments from natural, organic, and high-quality ingredients. Vendors are increasingly introducing innovative, unique, and international flavours of speciality condiments, including plant-based spreads, low-sugar cooking sauces, and a range of authentic ethnic products. In September 2024, Kikkoman launched its Umami Joy Sauce, a distinctive condiment with a tomato base, free from soy and wheat. This creative sauce appeals to consumers seeking flavorful alternatives and enhances umami profiles in various dishes.
The launch of new products will further enhance the clean-labelled, speciality, organic, and gluten-free condiments' popularity. This has been identified as a critical condiments market trend, which will have a positive impact on the expansion of the condiments market.
Read more about this report - REQUEST FREE SAMPLE COPY IN PDF
Rising online sales, sustainable packaging solutions and the popularity of vegan condiments are driving the condiments market value.
The expansion of the e-commerce sector is projected to grow at a CAGR of 14.5% until 2026, according to the International Trade Administration, driving the online sales of condiments. Consumers prefer online channels for their convenience of doorstep delivery, generous discounts from dealers and the ability to return or exchange damaged products. This shift has opened new avenues for both well-established brands and niche, artisanal condiment producers to reach a larger, global audience, leading to an overall increase in the market revenue.
Rising concerns about obesity and overall health, especially in the global West, have led consumers to seek healthier alternatives to traditional condiments. According to the Food and Agriculture Organisation, a quarter of the population in the US, Europe and Oceania was classified as obese in 2022. As a result, the market witnessed an increasing demand for low-sugar, sugar-free, and low-calorie condiments that offer the same flavour profile without contributing to excessive calorie intake. This trend is especially strong among those following low-carb or ketogenic diets, boosting industry sales.
Condiment manufacturers are focusing on sustainable packaging of their products to ensure long-term market growth and stability. Sustainable packaging not only reduces their carbon footprint but also enhances their brand value, especially among eco-conscious consumers. As a result, their shift towards eco-friendly packaging solutions such as recyclable glass bottles, biodegradable containers, and plant-based plastics remains imminent. In April 2022, Mondi launched new packaging solutions for the food industry, PerFORMing Monoloop and Mono Formable, especially fresh food manufacturers, providing them with high-barrier protection and recyclable benefits.
The growing adoption of vegan and plant-based diets is leading to a surge in the demand for vegan condiments, which are healthier, sustainable, and ethically aligned with food consumption goals. A few of these condiments widely available in the market include vegan mayo, plant-based sauces, and dairy-free dressings. In March 2024, NIÚKE Foods introduced a brand-new line of plant-based condiments, including eight varieties of chickpea vegan mayonnaise. Such efforts are expected to fuel long-term opportunities in the condiments market.
Read more about this report - REQUEST FREE SAMPLE COPY IN PDF
The EMR’s report titled “Global Condiments Market Report and Forecast 2026-2035” offers a detailed analysis of the market based on the following segments:
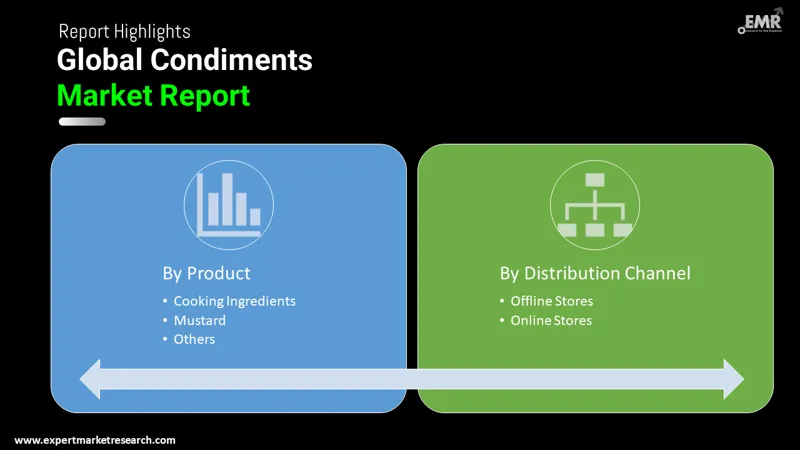
Market Breakup by Product
Market Breakup by Distribution Channel
Market Breakup by Region
| CAGR 2026-2035 - Market by | Country |
| India | 6.0% |
| China | 5.1% |
| UK | 4.1% |
| USA | 4.0% |
| Germany | 3.7% |
| Canada | XX% |
| France | XX% |
| Italy | XX% |
| Japan | 3.1% |
| Australia | XX% |
| Saudi Arabia | XX% |
| Brazil | XX% |
| Mexico | XX% |


According to the condiments market analysis, online stores lead the market by offering easy comparison shopping, personalised recommendations, and home delivery services, catering to busy lifestyles, and driving overall sales growth in the condiment sector. This segment is expected to see robust growth, with a projected CAGR of 6.8% from 2026 to 2035. In May 2024, Amazon launched a new subscription service for gourmet condiments, offering curated monthly selections. This initiative aims to boost customer engagement and encourage repeat purchases through convenience and variety.
Offline stores, such as supermarkets and speciality shops, provide immediate access to a wide range of condiments, enhancing the shopping experience through sampling and promotions, which encourages impulse purchases and increases market sales. In March 2024, Kraft Heinz expanded its condiment product range in major North American supermarkets, aiming to increase visibility and accessibility for consumers seeking diverse flavours, which is expected to significantly boost sales.
The condiments market key players produce a wide array of products, including condiments, sauces, ready-to-eat meals, cheese, and snacks. Renowned for their innovation in food manufacturing, these companies have a strong presence in both retail and food service sectors, serving millions of consumers globally. They focus on sustainability, aiming to reduce their environmental impact through initiatives like sustainable sourcing, waste reduction, and eco-friendly packaging.
Headquartered in Chicago, Illinois, Conagra Brands was established in 1919. The company is a leading North American manufacturer of branded food products, offering a wide range of condiments, snacks, meals, and frozen foods. Its popular brands include Healthy Choice, Hunt's, and Slim Jim.
Founded in 1886 and headquartered in Walnut Creek, California, Del Monte Foods is a major American producer of processed food products. Known for its canned fruits and vegetables, the company also offers a wide range of condiments, beverages, and snacks under its Del Monte and other brand names.
Established in 1919 and based in Tokyo, Japan, is renowned for producing mayonnaise, dressings, and sauces. The company is a leading condiment manufacturer in Japan, known for its high-quality products. Kewpie also offers a wide range of other food products, including processed foods and seasonings.
Founded in 1889 and headquartered in Hunt Valley, Maryland, is a global leader in the spice, seasoning, and condiment industry. The company offers a vast range of products, including spices, herbs, seasoning mixes, sauces, and condiments, serving both retail and food service markets.
*Please note that this is only a partial list; the complete list of key players is available in the full report. Additionally, the list of key players can be customized to better suit your needs.*
Other key players in the condiments market report include Unilever PLC, The Kraft Heinz Company, and Nestle SA among others.


Upto 15% Off
USD
$2499 $2249
$3999 $3599
$4999 $4249
$5999 $5099


*While we strive to always give you current and accurate information, the numbers depicted on the website are indicative and may differ from the actual numbers in the main report. At Expert Market Research, we aim to bring you the latest insights and trends in the market. Using our analyses and forecasts, stakeholders can understand the market dynamics, navigate challenges, and capitalize on opportunities to make data-driven strategic decisions.*
Get in touch with us for a customized solution tailored to your unique requirements and save upto 35%!
The market is assessed to grow at a CAGR of 4.50% between 2026 and 2035.
The major drivers of the industry such as rising consumption of fast foods, launch of clean-labelled, specialty, organic, and gluten-free condiments', shifting business trends, and government subsidies are expected to aid the market growth.
The key market trends guiding the growth of the condiments market include the shifting preferences among consumers towards the clean-labelled, gluten-free, and organic condiment products and the growing awareness of condiment’s various health advantages.
The major regions in the industry are North America, Europe, the Asia Pacific, Latin America and the Middle East and Africa.
Table sauces, cooking ingredients and mustard, among others are the major products of condiments.
The offline and online stores are the significant distribution channels of the industry.
The major players in the industry are Conagra Brands, Inc. (NYSE: CAG), Del Monte Foods, Inc., Kewpie Corporation, McCormick & Company, Inc., Unilever PLC, The Kraft Heinz Company, Nestle SA, Others.
In 2025, the market reached an approximate value of USD 30.90 Billion.
The market is estimated to witness healthy growth in the forecast period of 2026-2035 to reach a value of around USD 47.99 Billion by 2035.
Explore our key highlights of the report and gain a concise overview of key findings, trends, and actionable insights that will empower your strategic decisions.
| REPORT FEATURES | DETAILS |
| Base Year | 2025 |
| Historical Period | 2019-2025 |
| Forecast Period | 2026-2035 |
| Scope of the Report |
Historical and Forecast Trends, Industry Drivers and Constraints, Historical and Forecast Market Analysis by Segment:
|
| Breakup by Product |
|
| Breakup by Distribution Channel |
|
| Breakup by Region |
|
| Market Dynamics |
|
| Competitive Landscape |
|
| Companies Covered |
|
| Report Price and Purchase Option | Explore our purchase options that are best suited to your resources and industry needs. |
| Delivery Format | Delivered as an attached PDF and Excel through email, with an option of receiving an editable PPT, according to the purchase option. |
Datasheet
One User
USD 2,499
USD 2,249
tax inclusive*
Single User License
One User
USD 3,999
USD 3,599
tax inclusive*
Five User License
Five User
USD 4,999
USD 4,249
tax inclusive*
Corporate License
Unlimited Users
USD 5,999
USD 5,099
tax inclusive*
*Please note that the prices mentioned below are starting prices for each bundle type. Kindly contact our team for further details.*
Flash Bundle
Small Business Bundle
Growth Bundle
Enterprise Bundle
*Please note that the prices mentioned below are starting prices for each bundle type. Kindly contact our team for further details.*
Flash Bundle
Number of Reports: 3
20%
tax inclusive*
Small Business Bundle
Number of Reports: 5
25%
tax inclusive*
Growth Bundle
Number of Reports: 8
30%
tax inclusive*
Enterprise Bundle
Number of Reports: 10
35%
tax inclusive*
How To Order

Select License Type
Choose the right license for your needs and access rights.

Click on ‘Buy Now’
Add the report to your cart with one click and proceed to register.

Select Mode of Payment
Choose a payment option for a secure checkout. You will be redirected accordingly.
Gain insights to stay ahead and seize opportunities.

Get insights & trends for a competitive edge.

Track prices with detailed trend reports.

Analyse trade data for supply chain insights.

Leverage cost reports for smart savings

Enhance supply chain with partnerships.

Connect For More Information
Our expert team of analysts will offer full support and resolve any queries regarding the report, before and after the purchase.
Our expert team of analysts will offer full support and resolve any queries regarding the report, before and after the purchase.
We employ meticulous research methods, blending advanced analytics and expert insights to deliver accurate, actionable industry intelligence, staying ahead of competitors.
Our skilled analysts offer unparalleled competitive advantage with detailed insights on current and emerging markets, ensuring your strategic edge.
We offer an in-depth yet simplified presentation of industry insights and analysis to meet your specific requirements effectively.


Share