

Consumer Insights
Uncover trends and behaviors shaping consumer choices today
Procurement Insights
Optimize your sourcing strategy with key market data
Industry Stats
Stay ahead with the latest trends and market analysis.

The global cleaning services market size was valued at USD 79.02 Billion in 2025. The hospitality sector’s shift toward outsourced deep-cleaning and hygiene audits has opened up specialised service contracts, enabling cleaning providers to scale operations and offer bundled regulatory compliance across high-traffic environments. As a result, the market is expected to grow at a CAGR of 6.40% during the forecast period of 2026-2035 to reach a value of USD 146.94 Billion by 2035. The market is also driven by increased demand from sectors like healthcare, manufacturing, and commercial real estate. According to the Bureau of Labor Statistics, janitorial services are expected to grow by 3% in the United States. alone, reflecting the size and economic significance of this sector.
Government initiatives are further resulting in cleaning services market development. For instance, the United Kingdom government's Facilities Management Strategy 2022 mandated all public institutions to adopt sustainable and tech-integrated cleaning practices. Meanwhile, India’s Swachh Bharat Abhiyan (Clean India Mission) continues to expand the urban and rural cleaning service demand, with over 600,000 villages reportedly achieving "open-defecation-free" status, creating massive need for upkeep and sanitation maintenance.
Moreover, advanced cleaning has become a compliance mandate across all sectors. In the post-COVID landscape, businesses are investing more in specialised cleaning, such as electrostatic disinfection and UV-C sanitation. Companies are also under growing pressure to adopt green cleaning materials and IoT-based monitoring systems, fuelling demand for premium and tech-forward cleaning solutions. The global cleaning services industry is becoming more fragmented, driven by regional regulations, evolving hygiene standards, and rising outsourcing culture.
Base Year
Historical Period
Forecast Period
As per the World Health Expenditure up to March 2023, Canada topped the highest health expenditure of up to 12.9% of the GDP, followed closely by France at 12.8% and Australia at 12.2%
As per cleaning services market statistics, Argentina spent 10% and Australia 10.3%. Mexico used 6.2% of its GDP in dealings of health issues, Vietnam and Sri Lanka used 4.1% each. India had the lowest expenditure of 2.9%, according to the March 2023 Global Health Expenditure Database.
Sustainable practices are gaining traction, accelerating the shift towards green cleaning services including lowering plastic wastage and increasing recycling rates.
Compound Annual Growth Rate
6.4%
Value in USD Billion
2026-2035
*this image is indicative*
| Cleaning Services Market Report Summary | Description | Value |
| Base Year | USD Billion | 2025 |
| Historical Period | USD Billion | 2019-2025 |
| Forecast Period | USD Billion | 2026-2035 |
| Market Size 2025 | USD Billion | 79.02 |
| Market Size 2035 | USD Billion | 146.94 |
| CAGR 2019-2025 | Percentage | XX% |
| CAGR 2026-2035 | Percentage | 6.40% |
| CAGR 2026-2035 - Market by Region | Asia Pacific | 8.3% |
| CAGR 2026-2035 - Market by Country | India | 9.5% |
| CAGR 2026-2035 - Market by Country | Canada | 7.9% |
| CAGR 2026-2035 - Market by Service Type | Window Cleaning | 7.2% |
| CAGR 2026-2035 - Market by End Use | Residences | 7.3% |
| Market Share by Country 2025 | India | 3.0% |
The deployment of AI-powered robotic cleaners, IoT-enabled dispensers, and data-driven workflow optimisation is changing how facilities are cleaned, boosting the cleaning services market dynamics. In April 2025, Tennant Company launched autonomous floor scrubbers with real-time data tracking. On the other hand, Singapore’s NEA offers Happy Toilet Program, which integrates IoT sensors to notify cleaning needs automatically. This automation reduces labour costs and improves cleaning consistency, which happens to be a top priority in healthcare and airport facilities. Enterprises are adopting technology not only to ensure hygiene but to capture usage patterns and reduce wastage.
Environmental consciousness is reshaping procurement decisions across industries, influencing the cleaning services market trends. B2B buyers now prioritise biodegradable products and water-saving systems. The United States Green Seal Program certified several cleaning products, reflecting demand for sustainability assurance. Service contracts increasingly include carbon tracking and waste minimisation KPIs. Facilities such as office parks and educational institutes are inclining towards LEED-certified maintenance strategies. Suppliers are responding to this trend by offering eco-labelled chemicals, HEPA vacuuming systems, and reduced-emission equipment.
With rising facility management complexity, companies are increasingly outsourcing services, boosting the cleaning services market value. This model allows firms to access skilled labour and tech-enabled solutions. Countries like UAE have made soft services outsourcing mandatory in many free zones. This shift is fuelling a surge in B2B demand, with tailored cleaning contracts focusing on performance metrics and operational transparency. Providers are innovating by offering bundled services such as cleaning, pest control, and waste management under one contract, meeting the modern needs of commercial infrastructure.
Every sector requires specialised cleaning, from cleanroom sterilisation in pharma to grease management in industrial kitchens. For instance, ABM Industries offers specialised hospital cleaning services. Similarly, food processing plants are complying with FDA cleaning standards, pushing demand for anti-microbial and high-heat sanitation services and boosting demand in the cleaning services market. With ISO and OSHA tightening compliance in facilities, B2B players are investing in industry-aligned cleaning partners. This shift has resulted in targeted service development, such as cryogenic cleaning for manufacturing plants and ATP bioluminescence testing in labs.
Workplace hygiene is being increasingly perceived as a key priority to employee well-being and retention. As per the cleaning services market analysis, 86% of employees consider cleanliness a critical factor for job satisfaction. Companies are investing in routine disinfection, air purification, and odour control, especially in co-working and flexible office spaces. The WELL Building Standard also includes cleaning protocols as part of its certification process. Multinational firms are turning to service providers that understand wellness metrics and can deliver consistently high standards.
Read more about this report - REQUEST FREE SAMPLE COPY IN PDF
The EMR’s report titled “Global Cleaning Services Market Report and Forecast 2026-2035” offers a detailed analysis of the market based on the following segments:
Market Breakup by Service Type
Key Insight: The service type category includes window cleaning, maid services, carpet & upholstery, and others. Window cleaning is often demanded in high-rise commercial complexes, driven by safety regulations and appearance standards. Maid services have become increasingly popular among co-living spaces and short-term rentals. Carpet & upholstery cleaning is gaining traction due to rising allergy concerns. Vacuuming and floor care remain dominant due to high-frequency needs. Providers are customising offerings using technology and industry-specific chemicals, positioning themselves as partners in hygiene compliance, not only service vendors, accelerating the cleaning services consumption.
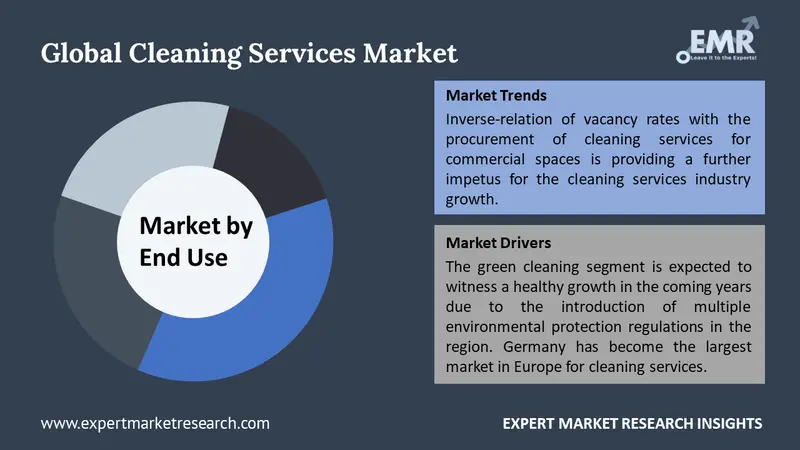
Market Breakup by End Use
Key Insight: Offices continue to be the dominant end use while healthcare facilities are emerging fast, boosting overall growth in the cleaning services market. Retail demands daily cleaning to ensure customer experience. Educational facilities focus on seasonal deep cleaning and sanitisation. Government buildings require contract-based services with security clearance. Residences, especially luxury apartments, expect hotel-grade service. Industrial plants require grit removal and hazardous waste cleanup.
Market Breakup by Region
Key Insight: The North America cleaning services market continues to occupy the dominant share owing to the region’s strong emphasis for compliance and technology. On the other hand, the Asia Pacific region emerges as the fastest-growing regional market as it increasingly prioritises scalability and cost-efficiency. Europe is focusing on green cleaning regulations; Latin America is adopting bundled service models, while Middle East and Africa are investing in hospitality and airport cleanliness due to the tourism sector’s growth. Service providers tailoring regional strategies such as language training, certifications, and service modularity are expected to gain competitive advantage.
By Service Type, the Vacuuming, Floor Care Category Holds the Dominant Share of the Market
Vacuuming and floor care represent the largest service type. Most corporate buildings and retail spaces demand daily or weekly maintenance to meet visual and hygiene standards. The category dominates due to high-frequency usage and the need for specialised tools like low-noise vacuums, floor buffers, and HEPA filter systems. Retail chains like Walmart are investing in AI-integrated floor scrubbers, enhancing efficiency and transparency. In industrial facilities, anti-slip treatment and epoxy floor polishing have gained momentum.
Demand for carpet and upholstery cleaning is growing rapidly, especially in luxury hotels, coworking spaces, and healthcare settings, stimulating the cleaning services market revenue growth. B2B buyers are inclining towards hot water extraction and encapsulation methods for hygiene and allergen control. With the global hospitality sector bouncing back in the post-COVID era, high-traffic areas demand quick-dry and deep-clean methods. For instance, Marriott International rolled out steam cleaning protocols. Meanwhile, schools and cinemas are investing in antimicrobial upholstery protection, driving service demand. Technological solutions like UV-C fabric sanitisers and portable extraction units are making service delivery faster and more targeted, which appeals to high-occupancy B2B facilities.
By End Use, Offices Register the Largest Share of the Global Market
Corporate offices drive the maximum demand for cleaning service contracts, especially in metro hubs like London, New York, and Singapore. As hybrid work trends stabilise, offices are revamping spaces with increased hygiene protocols. Restroom sanitisation, common area disinfection, and HVAC cleaning have become industry norms. Companies are using Google trends to implement predictive cleaning schedules based on occupancy data. Open-plan offices and shared desks have resulted in increased demand for daytime cleaning and surface sanitation. B2B contracts also emphasise eco-friendly materials and air quality metrics, adding value to routine cleaning.
The healthcare facilities management sector observes exponential growth in the cleaning services market, primarily due to increased focus on hygiene and cleanliness in healthcare settings to avoid the spread of various diseases and provide a healthy and safe environment to patients as well as healthcare professionals. Increase in incidences of lifestyle-related diseases and a shift towards health and a better lifestyle support the demand for healthcare services, which further generates the demand for proper cleaning and upkeep of healthcare facilities. Services include terminal cleaning, biohazard disposal, and isolation room sanitisation.


By Region, North America Secures the Leading Position in the Industry
The ongoing dominance of the North American market is sustained by advanced infrastructure and strict health compliance laws. OSHA and CDC guidelines demand high cleaning frequency across offices, factories, and healthcare. Moreover, United States-based firms are also embracing ESG goals, integrating green cleaning into procurement. Facility management contracts have become longer, value-driven, and heavily monitored. Canada is also witnessing rising demand in remote regions via mobile cleaning units. Service providers in this region are shifting towards subscription-based models, bundled services, and cloud-based scheduling to meet client expectations.
| CAGR 2026-2035 - Market by | Country |
| India | 9.5% |
| China | 7.9% |
| Canada | 7.9% |
| USA | 6.8% |
| Australia | 5.6% |
| Japan | 5.0% |
| UK | XX% |
| Germany | XX% |
| France | XX% |
| Italy | XX% |
| Saudi Arabia | XX% |
| Brazil | XX% |
| Mexico | XX% |
Asia Pacific offers lucrative cleaning services market opportunities, with urbanisation, real estate development, and hygiene awareness on the rise. India, China, and Southeast Asia have become major growth hubs. Smart city missions and industrial park expansions are creating huge B2B opportunities. In India, facility outsourcing witnessed 81% of organisations planning to increase efforts due to labour cost advantage and technology integration. Businesses are also demanding energy-efficient cleaning, ISO-compliant services, and multilingual crew training.
Key cleaning services market players are focusing on automated equipment, subscription-based B2B models, and industry-specific offerings. Opportunities lie in vertical integration. For instance, companies offering sanitation, HVAC, and waste management as one package are expected to gain more contracts over the forecast period.
In addition, there is another strategic shift toward client education, offering dashboards and hygiene audits. Partnerships with chemical suppliers and robotics firms are expanding. Smart cleaning technology, eco-friendly products, vertical specialisation, hybrid workplace sanitation, and B2B outsourcing contracts are some of the major trends noticed in the global market. Cleaning services companies that align closely with evolving regulations and workplace wellness standards are expected to grow in this competitive market. Green cleaning certification, multilingual training, and compliance transparency have become the major USPs.
Sodexo Group was founded in 1966 and is headquartered in France. The company specialises in integrated facilities management, with advanced cleaning services for healthcare, defence, and education sectors. The company is investing in green cleaning products and IoT-enabled service tracking.
C&W Facility Services, Inc. was established in 1917 and is based in New York, United States. The firm offers janitorial and speciality cleaning services tailored to industrial and commercial clients. Known for integrating data analytics in daily workflows, it also leads in sustainable cleaning.
ISS Group was formed in 1901 and operates from Copenhagen, Denmark. They provide global facilities services, focusing on customised cleaning for pharmaceutical, transportation, and energy sectors. The company uses AI-led scheduling and remote monitoring to deliver consistent service.
ABM Industries Inc. was founded in 1909 with headquarters in New York City. The company focuses on end-to-end building maintenance and offers services like infection control, UV sanitation, and high-dust cleaning. ABM caters to B2B clients needing high compliance and real-time reporting.
*Please note that this is only a partial list; the complete list of key players is available in the full report. Additionally, the list of key players can be customized to better suit your needs.*
Other key players in the market are Aramark Corporation, Jones Lang LaSalle IP, Inc, Compass Group PLC, The ServiceMaster Company, LLC, Cushman & Wakefield, Aden Group, Anago Cleaning Systems, Inc, and GSN Maschinen-Anlagen-Service GmbH, among others.
Explore the latest trends shaping the global cleaning services market 2026-2035 with our in-depth report. Gain strategic insights, future forecasts, and key market developments that can help you stay competitive. Download a free sample report or contact our team for customised consultation on cleaning services market trends 2026.
United States Laundry Facilities and Dry-Cleaning Services Market
Australia and New Zealand Cleaning Services Market
Australia Commercial Cleaning Services Market
North America Cleaning Services Market
Benelux Cleaning Services Market
Canada Cleaning Services Market
Europe Cleaning Services Market
Peru Cleaning Services Market


Upto 15% Off
USD
$2499 $2249
$3999 $3599
$4999 $4249
$5999 $5099


*While we strive to always give you current and accurate information, the numbers depicted on the website are indicative and may differ from the actual numbers in the main report. At Expert Market Research, we aim to bring you the latest insights and trends in the market. Using our analyses and forecasts, stakeholders can understand the market dynamics, navigate challenges, and capitalize on opportunities to make data-driven strategic decisions.*
Get in touch with us for a customized solution tailored to your unique requirements and save upto 35%!
In 2025, the cleaning services market reached an approximate value of USD 79.02 Billion.
The market is projected to grow at a CAGR of 6.40% between 2026 and 2035.
The market is estimated to witness a healthy growth in the forecast period of 2026-2035 to reach about USD 146.94 Billion by 2035.
Key strategies driving the market include investing in automation, expanding eco-product lines, training multilingual crews, adopting compliance dashboards, and bundling services for long-term contracts.
The key trends driving the market growth are strict regulatory policies, rising demand for sustainable cleaning solutions, and the growth of the healthcare industry.
The major regions in the market are North America, Latin America, Europe, Middle East and Africa, and Asia Pacific.
Offices, educational facilities, retail complexes, residences, government, healthcare facilities, and industrial plants, among others are the leading end uses in the market.
The major players in the market are Sodexo Group, C&W Facility Services, Inc., ISS Group, ABM Industries Inc., Aramark Corporation, Jones Lang LaSalle IP, Inc, Compass Group PLC, The ServiceMaster Company, LLC, Cushman & Wakefield, Aden Group, Anago Cleaning Systems, Inc, and GSN Maschinen-Anlagen-Service GmbH, among others.
The key challenges hindering companies in the cleaning services market include high labour turnover, skill gaps, rising material costs, and complexity of technology integration.
Explore our key highlights of the report and gain a concise overview of key findings, trends, and actionable insights that will empower your strategic decisions.
| REPORT FEATURES | DETAILS |
| Base Year | 2025 |
| Historical Period | 2019-2025 |
| Forecast Period | 2026-2035 |
| Scope of the Report |
Historical and Forecast Trends, Industry Drivers and Constraints, Historical and Forecast Market Analysis by Segment:
|
| Breakup by Service Type |
|
| Breakup by End Use |
|
| Breakup by Region |
|
| Market Dynamics |
|
| Competitive Landscape |
|
| Companies Covered |
|
Datasheet
One User
USD 2,499
USD 2,249
tax inclusive*
Single User License
One User
USD 3,999
USD 3,599
tax inclusive*
Five User License
Five User
USD 4,999
USD 4,249
tax inclusive*
Corporate License
Unlimited Users
USD 5,999
USD 5,099
tax inclusive*
*Please note that the prices mentioned below are starting prices for each bundle type. Kindly contact our team for further details.*
Flash Bundle
Small Business Bundle
Growth Bundle
Enterprise Bundle
*Please note that the prices mentioned below are starting prices for each bundle type. Kindly contact our team for further details.*
Flash Bundle
Number of Reports: 3
20%
tax inclusive*
Small Business Bundle
Number of Reports: 5
25%
tax inclusive*
Growth Bundle
Number of Reports: 8
30%
tax inclusive*
Enterprise Bundle
Number of Reports: 10
35%
tax inclusive*
How To Order

Select License Type
Choose the right license for your needs and access rights.

Click on ‘Buy Now’
Add the report to your cart with one click and proceed to register.

Select Mode of Payment
Choose a payment option for a secure checkout. You will be redirected accordingly.
Gain insights to stay ahead and seize opportunities.

Get insights & trends for a competitive edge.

Track prices with detailed trend reports.

Analyse trade data for supply chain insights.

Leverage cost reports for smart savings

Enhance supply chain with partnerships.

Connect For More Information
Our expert team of analysts will offer full support and resolve any queries regarding the report, before and after the purchase.
Our expert team of analysts will offer full support and resolve any queries regarding the report, before and after the purchase.
We employ meticulous research methods, blending advanced analytics and expert insights to deliver accurate, actionable industry intelligence, staying ahead of competitors.
Our skilled analysts offer unparalleled competitive advantage with detailed insights on current and emerging markets, ensuring your strategic edge.
We offer an in-depth yet simplified presentation of industry insights and analysis to meet your specific requirements effectively.


Share