

Consumer Insights
Uncover trends and behaviors shaping consumer choices today
Procurement Insights
Optimize your sourcing strategy with key market data
Industry Stats
Stay ahead with the latest trends and market analysis.

The Chile textile market attained a value of USD 5625.47 Million in 2025. The market is estimated to grow at a CAGR of 4.31% during 2026-2035 to reach a value of USD 8578.64 Million by 2035.
Base Year
Historical Period
Forecast Period
According to industry reports, 64.8% of the Chileans brought goods online in 2022 with clothing and shoes being the best-selling category.
In 2023, Chile’s import of curtains and valances made from synthetic fibres were valued at USD 2.24 million.
According to WTO, Chile ranks among the top markets in Latin America for per capita spending on clothing and footwear, second only to Uruguay.
Compound Annual Growth Rate
4.31%
Value in USD Million
2026-2035
*this image is indicative*
The Chile textile market is registering a tremendous pace of development due to the increased demand. The demand for premium household textiles has been consistent over the years which has been met by local industry. Several foreign players are also looking to tap into the market. In 2021, Rosen launched the copper health bedding line in Chile that features innovative textile technology with embedded copper particles.
The rise in sports retail is expected to prompt a 65.9% increase in new stores between 2018-2024, indicating a strong potential for the textile sector. Simultaneously, in September 2023, 25,765 new vehicles were sold, thus boosting demand for automotive textiles for seat covers, upholstery, and interior materials applications.
Chile's per capita spending rose to USD 9,833 in 2022, from USD 8,035 in 2020, encouraging consumers to invest more in fashion and clothing products, thereby supporting the Chile textile market expansion.
Further, in August 2024, retail sales in Chile saw a 6.8% y-o-y rise, with significant growth in the clothing, footwear, and accessories sectors.
The idea of a circular economy is gaining popularity in the textile market at a rapid rate. Circular economy highlights the importance of reducing waste, reusing materials, and recycling at the end lifecycle of the product. In August 2023, Procitex inaugurated a textile recycling plant in Chile and plans to recycle up to 500 tons per month. Consumers and industries are prioritising eco-friendly textiles that are encouraging sustainable and circular economy practices. Aligning with this, the Sustainable Design Chamber launched the Clean Production Agreement to manage textile waste over a 24-month initiative starting November 13, 2023.
In order to tap into the growing demand, key players are investing in order to improve their market position. For instance, Falabella – a specialist retailer for clothing and household goods recently unveiled a USD 508 million investment strategy for 2024, to bolster its omnichannel offerings and customer service.
In February 2023, Chile joined the Comprehensive and Progressive Agreement for Trans-Pacific Partnership (CPTPP), which already included 11 countries: Japan, Malaysia, Canada, New Zealand, Mexico, Singapore, Peru, Vietnam, Brunei, and Australia. This is likely to boost the Chile textile market growth by reducing tariffs and trade restrictions on textiles, further boosting trade opportunities for market players. Furthermore, Chilean textile firms can partner with CPTPP countries for technology, innovation, and sustainability to increase competitiveness.
In 2021, Chile experienced a rebound in clothing and footwear imports, reaching approx. 3 billion dollars, nearly returning to pre-pandemic levels seen in 2019.
According to the Santiago Chamber of Commerce (CCS), clothing has remained the most purchased item in Chile since 2020, accounting for 28% of total online sales that year. Additionally, during the first half of 2023, CCS estimated that 46% of Chilean consumers purchased clothing online each month, with footwear ranking second at 30%. According to the National Institute of Statistics, Chile's retail sales rose by 6.8% year-on-year in August 2024, following a 2.8% increase in July, driven by growth in clothing, footwear and accessories (15.5%), food (5%), and consumer goods (8.8%).
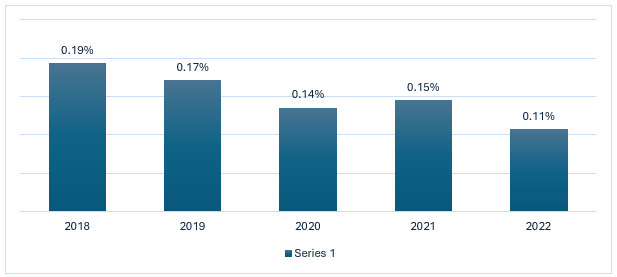
Between 2018 and 2022, the share of Chile's textile-clothing industry in the country's total economic value steadily declined, falling from 0.19% in 2018 to 0.11% in 2022. This decrease can be attributed to the rising competitive pressure from Asian nations, whose import dominance has significantly impacted Latin American industries, including Chile’s textile sector, reducing its overall contribution to the economy. Chile exemplifies the productive disintegration of the textile-apparel industry, which began in the 1970s when the country shifted toward importing lower-cost manufactured goods. This led to a surge in Asian garment imports and a significant decline in domestic production and employment in the sector. According to the World Bank, Chile's manufacturing industry fluctuated slightly between 2013 and 2019, peaking in 2014 at 2.20% and reaching its lowest point in 2016 at 1.71%.
Figure: Chile’s Textile-Clothing Industry: Share in Total Economic Value (2018-2022)
Economic growth enhances the purchasing power of consumers. Over the past 20 years, Chile has become Latin America's top clothing consumer per capita, with purchases rising by 233%. The average number of clothing items bought per person increased from 13 in 2015 to 50 in 2020, contributing to 572,118.9 tons of textile waste annually.
According to the World Bank, in 2019, textiles and clothing contributed 2.06% to the value added in Chile's manufacturing sector, underscoring the industry's modest yet significant role in the country's manufacturing economy.
Favourable government policies are expected to support the growth of the Chile textile market
The U.S.-Chile Free Trade Agreement (USCFTA) enhances the price competitiveness of U.S. textile and apparel exporters in the Chilean market by eliminating duties, enabling them to better compete with both domestic suppliers and suppliers from other countries without duty benefits. Additionally, by removing various non-tariff barriers, the FTA further expands market access in Chile for U.S. products.
India Chile PTA (Preferential Trade Agreement) is a framework agreement to promote economic cooperation between India and Chile. India has offered to provide fixed tariff preferences ranging from 10% to 50% on 178 tariff lines at the 8-digit level to Chile, the latter has offered tariff preferences on 296 tariff lines at the 8-digit level with a margin of preference ranging from 10% to 100%.
In 2024, European Free Trade Association (EFTA) and Chile convened to sign a Protocol of Amendment, modernizing their Free Trade Agreement (FTA), further strengthening economic ties between the two sides.
Growing trend of online shopping; increasing inclination towards sustainable products; favourable government policies; and rising disposable incomes are the key trends impacting the Chile textile market demand
The rise of online shopping, driven by fast fashion and social media, presents significant opportunities for Chilean textile companies to expand their market presence. With 64.8% of Chileans making online purchases in 2022, and eCommerce users expected to grow from 12.7 million in 2022 to 13.7 million by 2027, local retailers can capitalise on this trend by investing in digital platforms, which is further supported by a high internet penetration rate of 91%.
The growing demand for sustainable and eco-friendly products in Chile offers a significant opportunity for the textile market. As consumers become environmentally conscious, businesses adopting circular economy practices and reducing textile waste are well-positioned to succeed. Ecocitex, a Chilean enterprise selling 100% recycled textiles, exemplifies this potential by reducing environmental impact. This model highlights the opportunity for Chilean companies to lead in sustainable textiles and support national environmental goals.
Chile is Latin America’s fifth-largest economy. The country has an extensive network of Free Trade Agreements (FTAs) with various countries. The Chile and U.S. Free Trade Agreement (USCFTA) was signed on June 6, 2003 that allows U.S. textile and apparel exporters to be more price-competitive in the Chilean market when competing with domestic suppliers and with third country suppliers that do not have duty benefits. Through the elimination of a variety of non-tariff barriers, the FTA further opens the Chilean market to U.S. products.
Chile has a predominantly urban population (88%). With a thriving middle class, it has the highest disposable income in the region at approximately USD 10,300 per capita. Chile's per capita income is projected to grow steadily in the coming years, fueled by increased productivity and foreign investment.
The fast fashion sector in Chile has experienced significant growth, fueled by rising consumer demand for affordable and trendy clothing. Major international brands like Zara and H&M, along with local companies, have expanded their presence in the market, catering to a younger demographic seeking stylish options at accessible prices.
Meanwhile, the continuous growth of agriculture and related GDP from USD 20 billion in 2019 to USD 28.9 billion in 2023, with further contribution projected moving forward is likely to provide opportunities for agricultural textile products. The growing demand for such technical textile products is expected to increase the Chile textile market value.
In Chile, the most popular e-commerce categories are apparel and footwear, accounting for 48% of online purchases. These categories dominate the digital retail space, reflecting strong consumer demand in the fashion sector. Chile has a remarkable internet penetration rate, with 90.8% of its population connected in 2023. Most Chileans are highly engaged with social media, and there are approximately 1.4 mobile phones per person. Internet access reaches 92% of the population, highlighting the country’s strong digital connectivity. This is supporting the Chile textile market development by driving online sales of apparel and other textile products.
By 2026, 4G and 5G services are expected to cover 96% of the population, further enhancing the nation's digital infrastructure. This robust IT environment is attracting foreign investment, positioning Chile as a growing hub for technology development in Latin America.
The growing need for pest and disease control drives the demand for agriculture textiles like nets and covers. The IDB’s USD 50 million loan to Chile's agricultural sector will further boost this demand. Simultaneously, the growing focus on the transportation sector is expected to drive the demand for seat cover fabric, tufted carpet, seat belts, cabin filters, and others. In August 2022, the DTPM launched the Technical Transformation of the RED Network, a USD 500 million, ten-year plan to integrate Santiago’s public transportation network, improve its accessibility, and lower carbon emissions.
“Chile Textile Market Report and Forecast 2026-2035” offers a detailed analysis of the market based on the following segments:
Market Breakup by Application
Market Breakup by Material
Market Breakup by Product
Based on material, chemical fibres account for a significant share of the Chile textile market
Chemical fibres, among other materials, are witnessing a great demand. The growing demand for synthetic fibres like polyester has prompted brands like Tiendas Paris to introduce the "Be Active" sportswear collection featuring Repreve recycled polyester for eco-friendly, high-quality garments at accessible prices.
Meanwhile, the growth of cotton-based products is attributed to the growing demand for men’s apparel in Chile. In fact, between 2012-2021, approximately a third of the apparels imported in Chile was based of cotton.
Further, in 2022, Chile produced 4,000 tons of wool while constituting 2% of the global market share of wool programs. Notably, this was the first year that RWS (Responsible Wool Standard) wool was produced in Chile.
Based on product, natural fibre is a major contributor to the Chile textile market revenue
Cotton is a key natural fibre used in the textile industry in Chile. In 2022, Chile imported USD 453 thousand of raw cotton. In August 2024, The Chilean Ministry of Environment introduced a Draft Circular Economy Strategy for Textiles, aiming to promote sustainable practices by 2040. This strategy focuses on increasing the use of natural and sustainable materials. Additionally, wool is also used in Chile’s textile sector and there has been growing popularity among wool producers to meet Responsible Wool Standard (RWS), thus further accelerating the demand for natural fibre.
On the other hand, the growth of synthetic fibres, especially polyester, has significantly impacted the textile industry's economy, driving growth in the fast fashion sector. The growth of the fast fashion industry is positively impacting the Chile textile market development.
In Chile, the demand for affordable clothing and the low production costs of polyester have solidified its position as a leading fabric. Further, polyesters are commonly used in home décor items like curtains. In 2023, Chile’s import of curtains and valances made from synthetic fibres were valued at USD 2.24 million. Furthermore, the use of recycled polyester is gaining momentum in Chile, driven by growing awareness of environmental sustainability.
In recent years, Chile has seen a significant rise in demand for sportswear, which has contributed to the growing use of nylon in the country's sportswear industry. Moreover, Chile's automotive industry is poised for growth in 2024, with forecasts predicting 340,000 new vehicle sales in 2024. This upward trend is expected to drive greater demand for nylon tire yarn, as the need for durable, high-performance tires increases in tandem with vehicle sales.
The market players are focusing on providing products at competitive prices and high quality, with improved customer service and performance features.
Crossville Fabric Mill is a fully integrated textile producer specialising in fabrics for apparel and interior applications. Founded in 2022, the company produces and delivers high-quality fabric to various clothing producers with their offices in Chile, and the United States.
Ecocitex is a pioneering recycling and reuse company dedicated to eliminating textile waste in Chile. As the only company in the country to produce 100% recycled yarn, Ecocitex utilises damaged clothing collected and recycled locally, through a process that requires no water or dyes.
Textil HITEGA SA has developed deep expertise in producing high-quality flat fabrics for men’s and women’s clothing. Founded in 1944, the company follows a fully vertical production process, encompassing spinning, weaving, and dyeing of flat fabrics.
Founded in 1941, Reginella is a well-established textile company specialising in the manufacture of yarns for hand-woven garments, as well as for use in rectilinear, circular, and hosiery machines.
*Please note that this is only a partial list; the complete list of key players is available in the full report. Additionally, the list of key players can be customized to better suit your needs.*
Other notable players operating in the Chile textile market are Successori Reda S.p.A, Zahr Textiles, SINGOLARE, Arja Textil LTDA, and Garware Technical Fibres Ltd, among others.


Upto 15% Off
USD
$2499 $2249
$3999 $3599
$4999 $4249
$5999 $5099


*While we strive to always give you current and accurate information, the numbers depicted on the website are indicative and may differ from the actual numbers in the main report. At Expert Market Research, we aim to bring you the latest insights and trends in the market. Using our analyses and forecasts, stakeholders can understand the market dynamics, navigate challenges, and capitalize on opportunities to make data-driven strategic decisions.*
Get in touch with us for a customized solution tailored to your unique requirements and save upto 35%!
The Chilean textile market attained a value of USD 5625.47 Million in 2025.
The market is estimated to grow at a CAGR of 4.31% during 2026-2035.
The market is estimated to witness a healthy growth in the forecast period of 2026-2035 to reach a value of USD 8578.64 Million by 2035.
The factors driving the market growth are increasing inclination towards sustainable materials like cotton, rising online purchase of apparel and home textile products, rising disposable income, and rapid urbanisation.
The textile market is witnessing significant trends, including the integration of cutting-edge technologies and the increasing demand for smart clothing.
The materials include cotton, chemical fibres, wool, silk, and others.
The key applications are household, technical, fashion and clothing, and others.
The key players in the market include Crossville Fabric Chile S.A, ECOCITEX, HITEGA SA, Reginella, Successori Reda S.p.A, Zahr Textiles, SINGOLARE, Arja Textil LTDA, and Garware Technical Fibres Ltd, among others.
The product types include natural fibres, polyester, nylon, and others.
Explore our key highlights of the report and gain a concise overview of key findings, trends, and actionable insights that will empower your strategic decisions.
| REPORT FEATURES | DETAILS |
| Base Year | 2025 |
| Historical Period | 2019-2025 |
| Forecast Period | 2026-2035 |
| Scope of the Report |
Historical and Forecast Trends, Industry Drivers and Constraints, Historical and Forecast Market Analysis by Segment:
|
| Breakup by Material |
|
| Breakup by Product |
|
| Breakup by |
|
| Market Dynamics |
|
| Competitive Landscape |
|
| Companies Covered |
|
Datasheet
One User
USD 2,499
USD 2,249
tax inclusive*
Single User License
One User
USD 3,999
USD 3,599
tax inclusive*
Five User License
Five User
USD 4,999
USD 4,249
tax inclusive*
Corporate License
Unlimited Users
USD 5,999
USD 5,099
tax inclusive*
*Please note that the prices mentioned below are starting prices for each bundle type. Kindly contact our team for further details.*
Flash Bundle
Small Business Bundle
Growth Bundle
Enterprise Bundle
*Please note that the prices mentioned below are starting prices for each bundle type. Kindly contact our team for further details.*
Flash Bundle
Number of Reports: 3
20%
tax inclusive*
Small Business Bundle
Number of Reports: 5
25%
tax inclusive*
Growth Bundle
Number of Reports: 8
30%
tax inclusive*
Enterprise Bundle
Number of Reports: 10
35%
tax inclusive*
How To Order

Select License Type
Choose the right license for your needs and access rights.

Click on ‘Buy Now’
Add the report to your cart with one click and proceed to register.

Select Mode of Payment
Choose a payment option for a secure checkout. You will be redirected accordingly.
Gain insights to stay ahead and seize opportunities.

Get insights & trends for a competitive edge.

Track prices with detailed trend reports.

Analyse trade data for supply chain insights.

Leverage cost reports for smart savings

Enhance supply chain with partnerships.

Connect For More Information
Our expert team of analysts will offer full support and resolve any queries regarding the report, before and after the purchase.
Our expert team of analysts will offer full support and resolve any queries regarding the report, before and after the purchase.
We employ meticulous research methods, blending advanced analytics and expert insights to deliver accurate, actionable industry intelligence, staying ahead of competitors.
Our skilled analysts offer unparalleled competitive advantage with detailed insights on current and emerging markets, ensuring your strategic edge.
We offer an in-depth yet simplified presentation of industry insights and analysis to meet your specific requirements effectively.


Share