

Consumer Insights
Uncover trends and behaviors shaping consumer choices today
Procurement Insights
Optimize your sourcing strategy with key market data
Industry Stats
Stay ahead with the latest trends and market analysis.
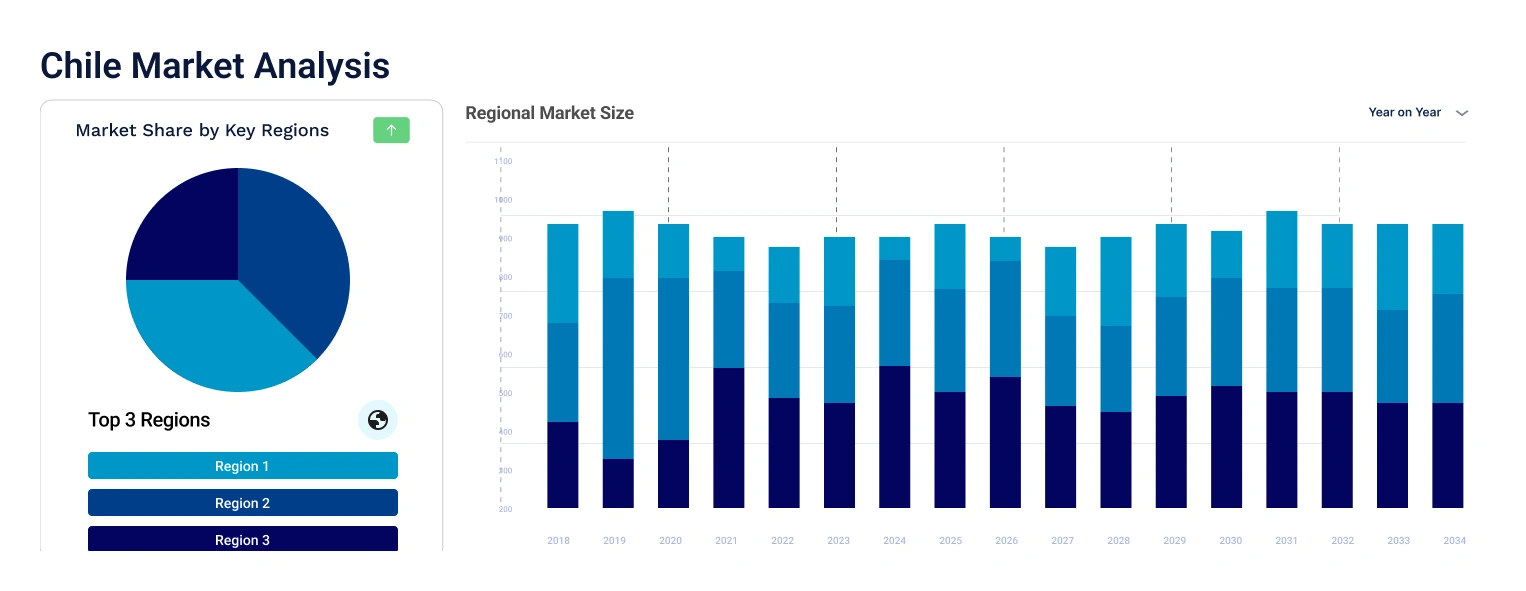
The Chile soft drinks market reached approximately USD 1.73 Billion in 2024. The market is projected to grow at a CAGR of 3.70% between 2025 and 2034, reaching a value of around USD 2.49 Billion by 2034.
Base Year
Historical Year
Forecast Year
As per the industry report in 2022, approximately 4.5 per cent of the GDP of Chile is represented by its food processing sector, which creates ample opportunities for soft drinks.
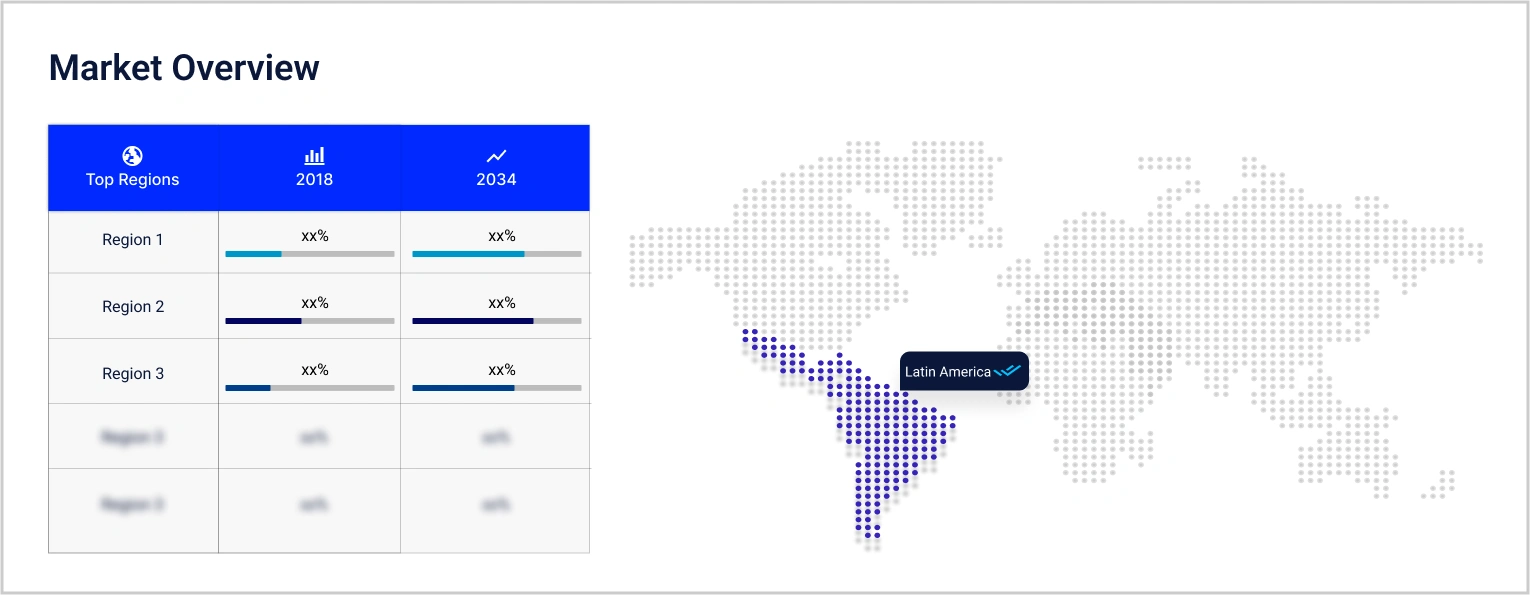
Chile is the fifth largest market for e-commerce in Latin America, which makes online stores a prominent platform for soft drink sales.
Manufacturers in the market are shifting towards low-sugar soft drinks due to the rising health consciousness in the country.


Value in USD Billion
2025-2034
Chile Soft Drinks Market Outlook
*this image is indicative*
The increased shift towards healthy soft drinks, rising efforts to target Gen-Z and new product offerings are some of the major factors boosting the market growth. Consumers in the country are now looking for soft drinks which contain ingredients such as probiotics and dietary fibres and can offer some health benefits along with providing hydration. Moreover, a large per cent of consumers prefer low or no-sugar drinks compared to sugar ones, due to the additives and sugar which can have a negative impact on health.
Manufacturers are appealing to Gen-Z consumers by the introduction of soft drinks with unique flavours and properties. For instance, some companies are offering spicy and savoury flavours such as ginger and turmeric to stand out from their competitors and offer a novel beverage experience. Meanwhile, some energy drink providers are leveraging social media platforms for the promotion of their products to reach a large segment of Gen Z consumers.
The rising incorporation of sustainable packaging solutions in soft drinks is a prominent trend influencing the market. Soft drink providers are investing in recyclable or biodegradable packaging solutions to reduce plastic waste, lower their carbon footprint, and boost the brand popularity among eco-conscious consumers. Personalisation is also an emerging trend in the Chilean market through which some companies are offering the provision of customised soft drinks to consumers based on their dietary preferences. This is a very niche segment which heavily relies on consumer loyalty and trust in the brand.
“Chile Soft Drinks Market Report and Forecast 2025-2034” offers a detailed analysis of the market based on the following segments:
Market Breakup by Product:
Market Breakup by Type:
Market Breakup by Packaging:
Market Breakup by Distribution Channel:
Hypermarkets and supermarkets represent a significant segment in the market. Customers can choose from a variety of beverages at these retail establishments, such as fruit juices, bottled water, and carbonated and non-carbonated soft drinks. The wide range of products offered is one of the main benefits of purchasing soft drinks at supermarkets and hypermarkets. These stores give customers the option of in-person product inspection while also boosting market revenue.
Customers are increasingly favoring mobile apps and online shopping portals because of their ease of use and convenience, which is likely to drive significant growth in the online segment. Soft drink selections offered by grocery delivery services—both retailer-owned and third-party—have increased, giving customers the choice to have their preferred drinks delivered right to their door.
The market players are introducing sustainable packaging solutions to meet the evolving regulatory landscape.
*While we strive to always give you current and accurate information, the numbers depicted on the website are indicative and may differ from the actual numbers in the main report. At Expert Market Research, we aim to bring you the latest insights and trends in the market. Using our analyses and forecasts, stakeholders can understand the market dynamics, navigate challenges, and capitalize on opportunities to make data-driven strategic decisions.*
Get in touch with us for a customized solution tailored to your unique requirements and save upto 35%!
In 2024, the market reached an approximate value of USD 1.73 Billion.
The market is estimated to grow at a CAGR of 3.70% between 2025 and 2034.
The soft drinks market is estimated to witness a healthy growth during 2025-2034 to reach around USD 2.49 Billion by 2034.
The market is being driven due to increased shift towards healthy soft drinks, rising efforts to target Gen-Z and new product offerings.
The key trends aiding the market include rising incorporation of sustainable packaging solutions and personalisation and customisation of drinks.
Based on product, market segmentations include carbonated, non-carbonated, and energy and sports drinks.
Various types of soft drinks are low/no calorie and regular.
The major players in the market are The Coca-Cola Company, Monster Beverage Corporation, Red Bull GmbH, CCU SA, and PepsiCo, Inc., among others.
Explore our key highlights of the report and gain a concise overview of key findings, trends, and actionable insights that will empower your strategic decisions.
| REPORT FEATURES | DETAILS |
| Base Year | 2024 |
| Historical Period | 2018-2024 |
| Forecast Period | 2025-2034 |
| Scope of the Report |
Historical and Forecast Trends, Industry Drivers and Constraints, Historical and Forecast Market Analysis by Segment:
|
| Breakup by Product |
|
| Breakup by Type |
|
| Breakup by Packaging |
|
| Breakup by Distribution Channel |
|
| Market Dynamics |
|
| Competitive Landscape |
|
| Companies Covered |
|
Datasheet
One User
USD 2,499
USD 2,249
tax inclusive*
Single User License
One User
USD 3,999
USD 3,599
tax inclusive*
Five User License
Five User
USD 4,999
USD 4,249
tax inclusive*
Corporate License
Unlimited Users
USD 5,999
USD 5,099
tax inclusive*
*Please note that the prices mentioned below are starting prices for each bundle type. Kindly contact our team for further details.*
Flash Bundle
Small Business Bundle
Growth Bundle
Enterprise Bundle
*Please note that the prices mentioned below are starting prices for each bundle type. Kindly contact our team for further details.*
Flash Bundle
Number of Reports: 3
20%
tax inclusive*
Small Business Bundle
Number of Reports: 5
25%
tax inclusive*
Growth Bundle
Number of Reports: 8
30%
tax inclusive*
Enterprise Bundle
Number of Reports: 10
35%
tax inclusive*
How To Order
Our step-by-step guide will help you select, purchase, and access your reports swiftly, ensuring you get the information that drives your decisions, right when you need it.

Select License Type
Choose the right license for your needs and access rights.

Click on ‘Buy Now’
Add the report to your cart with one click and proceed to register.

Select Mode of Payment
Choose a payment option for a secure checkout. You will be redirected accordingly.
Gain insights to stay ahead and seize opportunities.

Get insights & trends for a competitive edge.

Track prices with detailed trend reports.

Analyse trade data for supply chain insights.

Leverage cost reports for smart savings

Enhance supply chain with partnerships.

Connect For More Information
Our expert team of analysts will offer full support and resolve any queries regarding the report, before and after the purchase.
Our expert team of analysts will offer full support and resolve any queries regarding the report, before and after the purchase.
We employ meticulous research methods, blending advanced analytics and expert insights to deliver accurate, actionable industry intelligence, staying ahead of competitors.
Our skilled analysts offer unparalleled competitive advantage with detailed insights on current and emerging markets, ensuring your strategic edge.
We offer an in-depth yet simplified presentation of industry insights and analysis to meet your specific requirements effectively.
Australia
63 Fiona Drive, Tamworth, NSW
+61-448-061-727
India
C130 Sector 2 Noida, Uttar Pradesh 201301
+91-723-689-1189
Philippines
40th Floor, PBCom Tower, 6795 Ayala Avenue Cor V.A Rufino St. Makati City,1226.
+63-287-899-028, +63-967-048-3306
United Kingdom
6 Gardner Place, Becketts Close, Feltham TW14 0BX, Greater London
+44-753-713-2163
United States
30 North Gould Street, Sheridan, WY 82801
+1-415-325-5166
Vietnam
193/26/4 St.no.6, Ward Binh Hung Hoa, Binh Tan District, Ho Chi Minh City
+84-865-399-124
United States (Head Office)
30 North Gould Street, Sheridan, WY 82801
+1-415-325-5166
Australia
63 Fiona Drive, Tamworth, NSW
+61-448-061-727
India
C130 Sector 2 Noida, Uttar Pradesh 201301
+91-723-689-1189
Philippines
40th Floor, PBCom Tower, 6795 Ayala Avenue Cor V.A Rufino St. Makati City, 1226.
+63-287-899-028, +63-967-048-3306
United Kingdom
6 Gardner Place, Becketts Close, Feltham TW14 0BX, Greater London
+44-753-713-2163
Vietnam
193/26/4 St.no.6, Ward Binh Hung Hoa, Binh Tan District, Ho Chi Minh City
+84-865-399-124


Share