

Consumer Insights
Uncover trends and behaviors shaping consumer choices today
Procurement Insights
Optimize your sourcing strategy with key market data
Industry Stats
Stay ahead with the latest trends and market analysis.
Trending Now


Base Year
Historical Period
Forecast Period


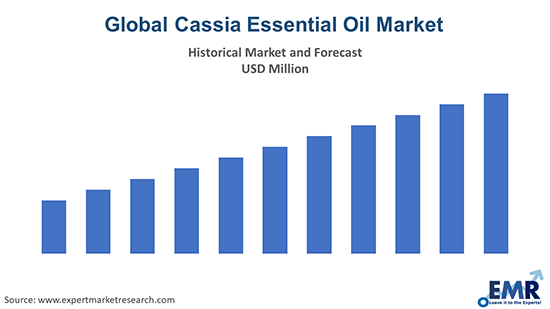
The global cassia essential oil market value is expected to grow at a CAGR of 8.1% in the forecast period of 2025-2034.
| Global Cassia Essential Oil Market Report Summary | Description | Value |
| Base Year | USD Million | 2023 |
| Historical Period | USD Million | 2018-2024 |
| Forecast Period | USD Million | 2025-2034 |
| Market Size 2024 | USD Million | XX |
| Market Size 2034 | USD Million | XX |
| CAGR 2018-2024 | Percentage | XX% |
| CAGR 2025-2034 | Percentage | 8.1% |
| CAGR 2025-2034 - Market by Region | Asia Pacific | 8.5% |
| CAGR 2025-2034 - Market by Country | India | 8.4% |
| CAGR 2025-2034 - Market by Country | China | 8.2% |
| CAGR 2025-2034 - Market by Nature | Organic | 10.2% |
| CAGR 2025-2034 - Market by Area of Plant | Leaves | 8.2% |
| Market Share by Country 2023 | India | 7.1% |
Read more about this report - REQUEST FREE SAMPLE COPY IN PDF
Rising Demand for Essential Oils Bolstering the Market Growth of Cassia Essential Oil
The rising demand for essential oils is the primary factor driving the growth of the cassia essential oil market. Rising health consciousness among consumers as well as the rising demand from the beauty and skincare industry is also propelling the growth of the market. Consumers use essential oils because of their natural quality and medicinal benefits to the skin. The rising cases of diarrheal diseases have globally affected the market over the last few years.


The rising cases of depression is also crucial in pushing the demand for cassia essential oil as customers of today's generation are struggling to adapt to hectic lifestyles as well as struggle to overcome occupational pressure. Cassia essential oil has many health benefits, such as treatment of diarrhoea, blood circulation improvement, and as an effective antidepressant. These vital health benefits of cassia essential oil are, thus, further boosting the demand of cassia essential oil market.
| Market Share by | Country |
| India | 7.1% |
| USA | XX% |
| Canada | XX% |
| UK | XX% |
As per the cassia essential oil market dynamics and trends, cassia essential oil has been recognised of late for its anti-inflammatory properties which makes it valuable in the treatment of arthritis as well as other musculoskeletal disorders.
The expansion of the cosmetic sector on a global scale is catering to a significant demand for cassia essential oil. In 2018, the cosmetic market size was recorded at USD 87.58 billion and slightly increased to USD 89.88 billion in 2019. As per the cassia essential oil industry analysis, a noticeable decline occurred in 2020 when the market shrank to USD 72.37 billion, likely due to the economic impacts of the COVID-19 pandemic. The subsequent recovery in 2021 brought the market up to USD 80.74 billion, followed by a more robust increase to USD 93.05 billion in 2022. This recovery trend continued into 2023, with the market size reaching USD 103.80 billion. The forecast for the coming years suggests a steady growth, with the market expected to grow to USD 108.40 billion in 2024, USD 113.20 billion in 2025, further to USD 118.50 billion in 2026, and USD 125.40 billion in 2027, culminating at USD 128.90 billion by 2028. This data reflects a strong rebound and sustained growth momentum in the cosmetics industry, driven by recovering consumer demand and ongoing market expansions.
According to OEC, in 2022, India stood as the leading exporter of essential oil, contributing 15.4% to the total export value, making it a dominant player in the market, which contributes to the growth of the cassia essential oil industry. The United States also holds a significant share at 12.1%, with its neighboring countries Mexico and Canada contributing 3.5% and 1.26% respectively. Brazil and France hold shares of 7.43% and 7.42% respectively. China and Germany have notable shares as well, at 7.12% and 4.39% respectively.
In 2017, import volumes of essential oils to Europe stood at 895.436 thousand tonnes. In 2018, there was an increase in imports, peaking at 971.560 thousand tonnes, which boosted the cassia essential oil industry revenue. The volume slightly reduced to 923.286 thousand tonnes in 2019. In 2020, imports remained close to previous years, with 974.102 thousand tonnes, indicating resilience in the market despite global disruptions. Furthermore, in 2021, there was a decrease compared to 2020, with imports recorded at 962.798 thousand tonnes.
Read more about this report - REQUEST FREE SAMPLE COPY IN PDF
Cassia essential oil is extracted from the cassia plant bark, leaves and twigs using steam distillation. Cassia is popularly referred to as Chinese cinnamon, and its scientific name is Cinnamomum Cassia. Cassia is a Chinese and Burman-native evergreen tree. Cassia benzaldehyde, chavicol, cinnamic aldehyde, cinnamyl acetate, and linalool are the most common parts in the essential oil. The essential oil is widely used in the healthcare industry where it is renowned for enhancing circulation, arthritis therapy, and depression.
Based on nature, the industry can be divided into the following:
| CAGR 2025-2034 - Market by | Nature |
| Organic | 10.2% |
| Conventional | XX% |
The area of plant can be divided as follows:
| CAGR 2025-2034 - Market by | Area of Plant |
| Leaves | 8.2% |
| Bark | XX% |
| Twigs | XX% |
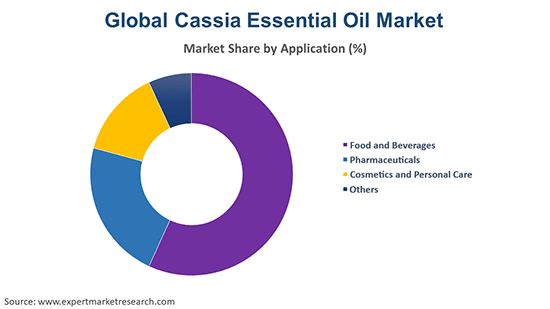
The distribution channels in the cassia essential oil market can be divided into on trade and off trade. The product finds wide applications in the following:
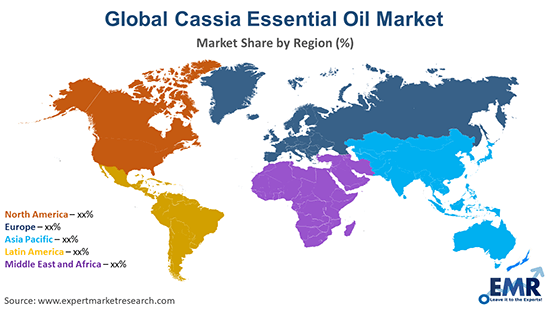
The regional markets for cassia essential oil can be divided into North America, Europe, the Asia Pacific, Latin America, and the Middle East and Africa.
| CAGR 2025-2034 - Market by | Region |
| Asia Pacific | 8.5% |
| Middle East and Africa | 7.9% |
| North America | XX% |
| Europe | XX% |
| Latin America | XX% |
| CAGR 2025-2034 - Market by | Country |
| India | 8.4% |
| China | 8.2% |
| Saudi Arabia | 7.8% |
| Canada | 7.6% |
| UK | 7.4% |
| USA | XX% |
| Germany | XX% |
| France | XX% |
The report gives a detailed analysis of the following key players in the global cassia essential oil market, covering their competitive landscape, capacity, and latest developments like mergers, acquisitions, and investments, expansions of capacity, and plant turnarounds:
The comprehensive EMR report provides an in-depth assessment of the market based on the Porter's five forces model along with giving a SWOT analysis.
Read more about this report - REQUEST FREE SAMPLE COPY IN PDF
The Asia Pacific to be a Major Regional Market for the Cassia Essential Oil Industry
The global cassia essential oil demand is being driven by the rising production of cassia in the Asia Pacific region. Cassia is widely cultivated in the Asia Pacific region, especially in countries like India, Indonesia, Thailand, Vietnam, Taiwan, and Malaysia. This has significantly aided the growth of the cassia essential oil industry in the region. The growing demand for natural cures in the region is also propelling the market growth.
| REPORT FEATURES | DETAILS |
| Base Year | 2023 |
| Historical Period | 2018-2024 |
| Forecast Period | 2025-2034 |
| Scope of the Report |
Historical and Forecast Trends, Industry Drivers and Constraints, Historical and Forecast Market Analysis by Segment:
|
| Breakup by Nature |
|
| Breakup by Area of Plant |
|
| Breakup by Distribution Channel |
|
| Breakup by Application |
|
| Breakup by Region |
|
| Market Dynamics |
|
| Competitive Landscape |
|
| Companies Covered |
|
| Report Price and Purchase Option | Explore our purchase options that are best suited to your resources and industry needs. |
| Delivery Format | Delivered as an attached PDF and Excel through email, with an option of receiving an editable PPT, according to the purchase option. |
Cassia Essential Oil Market Size
Cassia Essential Oil Market Growth
Cassia Essential Oil Market Trends
*While we strive to always give you current and accurate information, the numbers depicted on the website are indicative and may differ from the actual numbers in the main report. At Expert Market Research, we aim to bring you the latest insights and trends in the market. Using our analyses and forecasts, stakeholders can understand the market dynamics, navigate challenges, and capitalize on opportunities to make data-driven strategic decisions.*
Get in touch with us for a customized solution tailored to your unique requirements and save upto 35%!
The market is projected to grow at a CAGR of 8.1% between 2025 and 2034.
The major market drivers include rising population, growing demand for natural skincare and beauty products, and the growing demand for essential oils.
The rising prevalence of depression across the globe owing to the hectic lifestyles of the consumers and increasing disposable incomes are the key trends that are expected to guide the growth of the market in the coming years.
The major regions in the market are North America, Latin America, the Middle East and Africa, Europe, and the Asia Pacific.
The various types of natures in the market are organic and conventional.
The major areas of plant from which the cassia essential oil is derived are leaves, bark, and twigs, among others.
The significant distribution channels in the market are on trade and off trade.
The leading applications in the market are food and beverages, pharmaceuticals, and cosmetics and personal care, among others.
The major players in the global cassia essential oil market are Augustus Oils Ltd., NOW Health Group, Inc., doTERRA International, LLC, Young Living Essential Oils, Inovia International, and AG Industries, among others.
Datasheet
One User
USD 2,499
USD 2,249
tax inclusive*
Single User License
One User
USD 3,999
USD 3,599
tax inclusive*
Five User License
Five User
USD 4,999
USD 4,249
tax inclusive*
Corporate License
Unlimited Users
USD 5,999
USD 5,099
tax inclusive*
*Please note that the prices mentioned below are starting prices for each bundle type. Kindly contact our team for further details.*
Flash Bundle
Small Business Bundle
Growth Bundle
Enterprise Bundle
*Please note that the prices mentioned below are starting prices for each bundle type. Kindly contact our team for further details.*
Flash Bundle
Number of Reports: 3
20%
tax inclusive*
Small Business Bundle
Number of Reports: 5
25%
tax inclusive*
Growth Bundle
Number of Reports: 8
30%
tax inclusive*
Enterprise Bundle
Number of Reports: 10
35%
tax inclusive*
How To Order
Our step-by-step guide will help you select, purchase, and access your reports swiftly, ensuring you get the information that drives your decisions, right when you need it.

Select License Type
Choose the right license for your needs and access rights.

Click on ‘Buy Now’
Add the report to your cart with one click and proceed to register.

Select Mode of Payment
Choose a payment option for a secure checkout. You will be redirected accordingly.
Track prices with detailed trend reports.

Analyse trade data for supply chain insights.

Leverage cost reports for smart savings

Enhance supply chain with partnerships.

Gain insights to stay ahead and seize opportunities.

Get insights & trends for a competitive edge.

Track prices with detailed trend reports.
Analyse trade data for supply chain insights.
Leverage cost reports for smart savings
Enhance supply chain with partnerships.
Gain insights to stay ahead and seize opportunities.
Get insights & trends for a competitive edge.
Track prices with detailed trend reports.
Analyse trade data for supply chain insights.
Connect For More Information
Our expert team of analysts will offer full support and resolve any queries regarding the report, before and after the purchase.
Our expert team of analysts will offer full support and resolve any queries regarding the report, before and after the purchase.
We employ meticulous research methods, blending advanced analytics and expert insights to deliver accurate, actionable industry intelligence, staying ahead of competitors.
Our skilled analysts offer unparalleled competitive advantage with detailed insights on current and emerging markets, ensuring your strategic edge.
We offer an in-depth yet simplified presentation of industry insights and analysis to meet your specific requirements effectively.
Australia
63 Fiona Drive, Tamworth, NSW
+61-448-061-727
India
C130 Sector 2 Noida, Uttar Pradesh 201301
+91-723-689-1189
Philippines
40th Floor, PBCom Tower, 6795 Ayala Avenue Cor V.A Rufino St. Makati City,1226.
+63-287-899-028, +63-967-048-3306
United Kingdom
6 Gardner Place, Becketts Close, Feltham TW14 0BX, Greater London
+44-753-713-2163
United States
30 North Gould Street, Sheridan, WY 82801
+1-415-325-5166
Vietnam
193/26/4 St.no.6, Ward Binh Hung Hoa, Binh Tan District, Ho Chi Minh City
+84-865-399-124
United States (Head Office)
30 North Gould Street, Sheridan, WY 82801
+1-415-325-5166
Australia
63 Fiona Drive, Tamworth, NSW
+61-448-061-727
India
C130 Sector 2 Noida, Uttar Pradesh 201301
+91-723-689-1189
Philippines
40th Floor, PBCom Tower, 6795 Ayala Avenue Cor V.A Rufino St. Makati City, 1226.
+63-287-899-028, +63-967-048-3306
United Kingdom
6 Gardner Place, Becketts Close, Feltham TW14 0BX, Greater London
+44-753-713-2163
Vietnam
193/26/4 St.no.6, Ward Binh Hung Hoa, Binh Tan District, Ho Chi Minh City
+84-865-399-124


Share