


Consumer Insights
Uncover trends and behaviors shaping consumer choices today
Procurement Insights
Optimize your sourcing strategy with key market data
Industry Stats
Stay ahead with the latest trends and market analysis.

The global cash in transit services market was valued at USD 7906.60 Million in 2025. The market is expected to grow at a CAGR of 5.20% during the forecast period of 2026-2035 to reach a value of USD 13126.45 Million by 2035. Rising outsourcing of vault management and cash collection by e-commerce retailers is adding consistent demand for full-suite CIT providers globally.
The market is undergoing structural transformation, fueled largely by the resilience of cash usage in several geographies despite the ongoing digital wave. According to the cash in transit services market analysis, in 2024, cash represented 52% of global point-of-sale transaction value, and in regions like Latin America and the Middle East & Africa, cash dependency stood remarkably high at 31% and 43% respectively. This reliance sustains a steady flow of demand for secure currency transportation, especially between banks, retail hubs, and institutional vaults. A major driving factor behind the momentum is financial inclusion. India, for example, hosts 2,59,146 ATMs as of June 2023, creating opportunities for CIT providers in tier-3 and rural towns.
Innovation is further reshaping the cash in transit services market dynamics. Spain’s Prosegur Cash, for instance, rolled out electric armored fleets that claim annual carbon reduction of 15 tons in March 2025, aligning with sustainability mandates. Meanwhile, tech-enabled firms like Forware are embedding biometric-based route monitoring into CIT operations, which minimizes human error while aligning with security compliance.
Base Year
Historical Period
Forecast Period
Cash-in-transit (CIT) service facilitate the outsourcing of non-core banking services by offering secure and efficient cash handling. These services generally include ICT services and cloud services. In 2024, around 70% companies in Europe regularly deposited cash in their payment accounts, aiding the demand for cash in transit services.
In 2024, cash remained a vital payment tool globally, accounting for 16% of the global transactions and USD 6 trillion in value. As a result, there is a demand for cash in transit service for efficient cash processing.
Cash remains a popular payment method in Europe due to its easy accessibility. Cash was the most accepted means of payment across euro area companies, with 88% accepting cash payments, closely followed by payment cards (85%) in 2024.
In 2024, in the USA retail sector, 85% of retail market is organised and 67% of the organised retailers use some form of cash management solutions which in turn supports the demand for cash in transit service.
Compound Annual Growth Rate
5.2%
Value in USD Million
2026-2035
*this image is indicative*
| Global Cash in Transit Services Market Report Summary | Description | Value |
| Base Year | USD Million | 2025 |
| Historical Period | USD Million | 2019-2025 |
| Forecast Period | USD Million | 2026-2035 |
| Market Size 2025 | USD Million | 7906.60 |
| Market Size 2035 | USD Million | 13126.45 |
| CAGR 2019-2025 | Percentage | XX% |
| CAGR 2026-2035 | Percentage | 5.20% |
| CAGR 2026-2035 - Market by Region | Asia Pacific | 5.3% |
| CAGR 2026-2035 - Market by Country | India | 6.0% |
| CAGR 2026-2035 - Market by Country | Mexico | 5.7% |
| CAGR 2026-2035 - Market by End Use | Commercial Banks | 5.3% |
| Market Share by Country 2025 | USA | 24.9% |
The rollout of ATMs in remote locations remains a direct growth lever impacting the cash in transit services market value. In February 2025, Union Bank of India entrusted Findi Ltd. with the deployment of 900 ATMs across rural belts, all requiring replenishment and secure transport support. Across Sub-Saharan Africa, financial inclusion programs are pushing similar installations, ensuring physical cash remains accessible. This trend not only widens geographic demand for CIT players but also demonstrates how banks and governments lean on logistics partners to maintain service reliability in non-metro zones.
CIT companies are increasingly leveraging digital platforms to streamline fleet operations and enhance security. Forware, a fleet management solution tailored for the cash-in-transit sector, offers real-time route monitoring, automated dispatching, and biometric authorization, helping reduce human error and risk. Such technological integrations are becoming essential for providers aiming to meet the evolving demands of clients and regulatory bodies, widening the scope for the cash in transit services market expansion.
Environmental regulations and sustainability goals are prompting CIT companies to invest in eco-friendly transportation solutions. For instance, in March 2025, Prosegur Cash introduced Spain’s first electric armored vehicle in collaboration with the Polytechnic University of Madrid and TSD, aiming to reduce carbon emissions. These developments reflect a broader shift toward sustainable logistics within the cash-in-transit industry.
Strategic collaborations are advancing automation and cash logistics performance across regions, strengthening the cash in transit demand forecast. In July 2024, ESQ Data and CashPilot announced a partnership to integrate workflow automation tools into CIT operations, allowing for real-time tracking, predictive cash ordering, and digital reconciliation. This development streamlines cash management for banks and retailers, especially in locations lacking advanced backend systems.
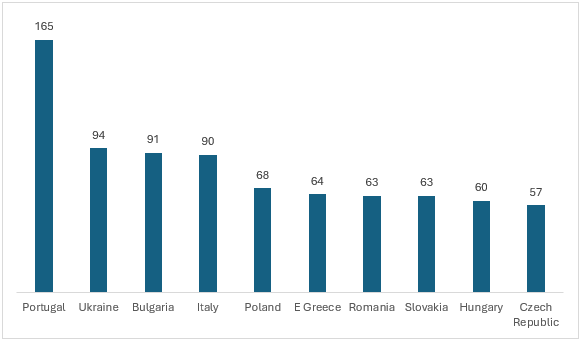
As per the cash in transit services market report, banks are prioritizing the operational efficiency of existing ATM infrastructure over rapid physical expansion. For instance, In India, the total number of ATMs reached 2.19 lakh by February 2024, compared to 1.97 lakh in 2016, reflecting a long-term emphasis on service reliability and cost efficiency. This shift is driving demand for CIT providers who can ensure high uptime, scheduled replenishment, and real-time cash availability across both urban and rural locations.
Figure: Leading European Countries with Most Number of ATMs (per 100,000 adults), 2022
The EMR’s report titled “Global Cash in Transit Services Market Report and Forecast 2026-2035” offers a detailed analysis of the market based on the following segments:
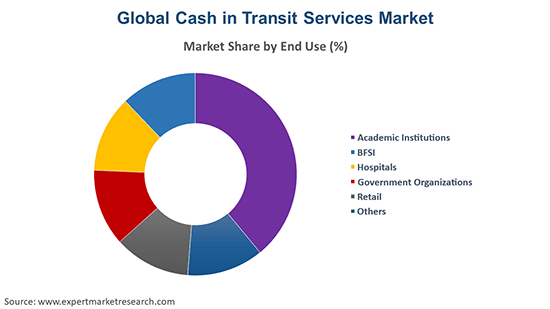
Market Breakup by End Use
Key Insight: Trends in the cash in transit services market indicate that commercial banks remain the largest end-use category, supported by the complexity of ATM networks and high-volume branch transactions. Central banks, though limited in number, rely on high-value interbank transfers and centralized vaulting. Meanwhile, NBFCs are witnessing the sharpest rise in demand, propelled by rural outreach and microfinance activities across emerging economies.
Market Breakup by Region
Key Insight: Regionally, the market spans across North America, Europe, Asia Pacific, Latin America, and the Middle East & Africa. North America leads in maturity with SLA-driven contracts and standardized armored fleets. Europe maintains stable growth through widespread outsourcing. Asia Pacific emerges as the fastest growing region, owing to ATM expansion and rural credit programs. The cash in transit services market in Latin America remains steady due to retail and remittance reliance. Meanwhile, Africa and the Middle East are scaling up with government-backed access programs.
Read more about this report - REQUEST FREE SAMPLE COPY IN PDF
Commercial Banks command the largest share of the market with ATM-driven cash handling
Commercial banks currently dominate the market, reflecting their extensive ATM networks, frequent branch-level transactions, and structured outsourcing models. Banks in developed regions like the United States, Germany, and Japan rely on CIT providers for inter-branch transfers, replenishment, and vaulting, governed by strict compliance. Meanwhile, emerging markets in Asia and the Middle East are expanding their ATM base under financial inclusion mandates, further deepening the demand for secure logistics.
Non-Banking Financial Institutions (NBFCs) are the fastest-expanding end-use category, driving the cash in transit services market growth. Their growth is tied to microfinance, cooperative lending, and rural-focused credit operations in South Asia and Sub-Saharan Africa. These firms operate in cash-first geographies, where digital banking infrastructure is either absent or underdeveloped. CIT partners enable them to carry out secure loan disbursement, cash collection, and storage support across widely dispersed rural geographies.


North America secures dominant share due to mature banking infrastructure
North America is the leading regional market for CIT services. The United States remains the hub where large commercial banks, federal agencies, and retail giants depend heavily on full-service CIT providers for armored transport, vaulting, and ATM servicing. Multi-year SLA-based contracts and standardized armored fleet systems reflect market maturity. Canada also contributes with institutional outsourcing practices. Security regulations and insurance-linked compliance drive continuous upgrades in fleet technologies, while sustainability initiatives are prompting slow but visible adoption of green armored fleets.
Growth of the Asia Pacific cash in transit services market, is largely powered by India, Indonesia, and the Philippines, where governments are promoting financial inclusion via ATM expansion and rural banking initiatives. In India alone, the RBI’s directive on rural ATM uptime continues to open steady opportunities for logistics providers. Additionally, NBFC-driven credit outreach is boosting secure cash cycle demand. Developing countries in the region are also witnessing remittance flows managed via cash-first transactions, further necessitating CIT services.
| CAGR 2026-2035 - Market by | Country |
| India | 6.0% |
| Mexico | 5.7% |
| China | 5.7% |
| USA | 5.2% |
| Canada | XX% |
| UK | XX% |
| France | XX% |
| Italy | 4.6% |
| Japan | XX% |
| Australia | XX% |
| Saudi Arabia | 7.1% |
| Brazil | XX% |
| Germany | 4.3% |
The global market is competitive. It can be characterized by a blend of global security giants, regional providers, and specialized fintech-logistics players. Cash in transit services companies are shifting focus toward bundled solutions that combine transport, vaulting, ATM management, and workflow automation. Fleet electrification, IoT-enabled route optimization, and AI surveillance are emerging as differentiators, reflecting rising client expectations for both sustainability and risk reduction. In Europe, tax credits for green fleet adoption are spurring investments, while in Asia, government-driven financial inclusion programs are opening new outsourcing contracts.
Partnerships between fintech firms and logistics players are adding value by automating cash management, particularly in markets with limited IT infrastructure. With increasing compliance obligations and security standards, cash in transit services market players who integrate technology into scalable models while maintaining geographic flexibility are positioned to lead the market over the coming years.
The Brink's Company, established in 1859 and headquartered in the United States, is a global security leader providing armored transport, secure logistics, and cash management solutions. Brink's is innovating with smart-vault technology and armored electric vehicle pilots that reduce emissions and offer encrypted telematics for route integrity.
Allied Universal, founded in 2016 through merger and headquartered in United States, is a leading integrated security and cash logistics provider. It offers armored transport, cash processing, and technology-enabled monitoring tailored for retail chains and corporate campuses. Allied is piloting modular mobile vault units and AI-driven threat detection for convoys, improving response times and predictive routing.
Loomis AB, established in 1852 and headquartered in Stockholm, Sweden, is a specialist in cash handling and valuables logistics. It provides cash-in-transit, automated teller machine services, and innovative front-office solutions like SafePoint cash recyclers and Loomis Pay.
GardaWorld Corporation, founded in 1995 and headquartered in Montreal, Canada, is a global integrated security and cash logistics provider serving financial institutions and corporates. The company is advancing with mobile vault concepts, connected smart-safes that enable instant digital reconciliation, and retrofit armored vehicle telematics for live risk scoring.
*Please note that this is only a partial list; the complete list of key players is available in the full report. Additionally, the list of key players can be customized to better suit your needs.*
Other key players in the market are Prosegur Group, Linfox Armaguard Pty Ltd., and Radiant Cash Management Services Limited, among others.
Explore the latest trends shaping the cash in transit services market 2026-2035 with our in-depth report. Gain strategic insights, future forecasts, and key market developments that can help you stay competitive. Download a free sample report or contact our team for customized consultation on cash in transit services market trends 2026.
Nigeria Cash in Transit Services Market
Cash in Transit Services Companies
Armored Vehicle Fleet Modernisation
Cash Logistics Software Market


Upto 15% Off
USD
$2499 $2249
$3999 $3599
$4999 $4249
$5999 $5099


*While we strive to always give you current and accurate information, the numbers depicted on the website are indicative and may differ from the actual numbers in the main report. At Expert Market Research, we aim to bring you the latest insights and trends in the market. Using our analyses and forecasts, stakeholders can understand the market dynamics, navigate challenges, and capitalize on opportunities to make data-driven strategic decisions.*
Get in touch with us for a customized solution tailored to your unique requirements and save upto 35%!
In 2025, the cash in transit services market reached an approximate value of USD 7906.60 Million.
The market is projected to grow at a CAGR of 5.20% between 2026 and 2035.
The market is estimated to witness healthy growth in the forecast period of 2026-2035 to reach a value of around USD 13126.45 Million by 2035.
Diversifying services, investing in telematics and green fleets, partnering with fintechs, automating reconciliation, upskilling staff, and negotiating longer SLAs are strengthening resilience and optimizing route economics for sustained competitive advantage.
The strict regulations for cash movement from one location to another by banks and rising crime rates are expected to be key trends guiding the growth of the market.
North America, Europe, the Asia Pacific, Latin America, and the Middle East and Africa are the leading regions in the market.
The leading end uses for the market are Central Banks, Commercial Banks, and Non Banking Financial Institutions, among others.
The key players in the market include The Brink's Company, Allied Universal, Loomis AB, GardaWorld Corporation, Prosegur Group, Linfox Armaguard Pty Ltd., and Radiant Cash Management Services Limited, among others.
The market is projected to grow at a CAGR of 5.20% between 2026 and 2035.
Rising operational costs, armed robberies, regulatory compliance variability, driver shortages, and integrating legacy systems with new tech are constraining margins and service reliability for CIT firms globally and insurance premiums.
Explore our key highlights of the report and gain a concise overview of key findings, trends, and actionable insights that will empower your strategic decisions.
| REPORT FEATURES | DETAILS |
| Base Year | 2025 |
| Historical Period | 2019-2025 |
| Forecast Period | 2026-2035 |
| Scope of the Report |
Historical and Forecast Trends, Industry Drivers and Constraints, Historical and Forecast Market Analysis by Segment:
|
| Breakup by End Use |
|
| Breakup by Region |
|
| Market Dynamics |
|
| Competitive Landscape |
|
| Companies Covered |
|
| Report Price and Purchase Option | Explore our purchase options that are best suited to your resources and industry needs. |
| Delivery Format | Delivered as an attached PDF and Excel through email, with an option of receiving an editable PPT, according to the purchase option. |
Datasheet
One User
USD 2,499
USD 2,249
tax inclusive*
Single User License
One User
USD 3,999
USD 3,599
tax inclusive*
Five User License
Five User
USD 4,999
USD 4,249
tax inclusive*
Corporate License
Unlimited Users
USD 5,999
USD 5,099
tax inclusive*
*Please note that the prices mentioned below are starting prices for each bundle type. Kindly contact our team for further details.*
Flash Bundle
Small Business Bundle
Growth Bundle
Enterprise Bundle
*Please note that the prices mentioned below are starting prices for each bundle type. Kindly contact our team for further details.*
Flash Bundle
Number of Reports: 3
20%
tax inclusive*
Small Business Bundle
Number of Reports: 5
25%
tax inclusive*
Growth Bundle
Number of Reports: 8
30%
tax inclusive*
Enterprise Bundle
Number of Reports: 10
35%
tax inclusive*
How To Order

Select License Type
Choose the right license for your needs and access rights.

Click on ‘Buy Now’
Add the report to your cart with one click and proceed to register.

Select Mode of Payment
Choose a payment option for a secure checkout. You will be redirected accordingly.
Gain insights to stay ahead and seize opportunities.

Get insights & trends for a competitive edge.

Track prices with detailed trend reports.

Analyse trade data for supply chain insights.

Leverage cost reports for smart savings

Enhance supply chain with partnerships.

Connect For More Information
Our expert team of analysts will offer full support and resolve any queries regarding the report, before and after the purchase.
Our expert team of analysts will offer full support and resolve any queries regarding the report, before and after the purchase.
We employ meticulous research methods, blending advanced analytics and expert insights to deliver accurate, actionable industry intelligence, staying ahead of competitors.
Our skilled analysts offer unparalleled competitive advantage with detailed insights on current and emerging markets, ensuring your strategic edge.
We offer an in-depth yet simplified presentation of industry insights and analysis to meet your specific requirements effectively.


Share