

Consumer Insights
Uncover trends and behaviors shaping consumer choices today
Procurement Insights
Optimize your sourcing strategy with key market data
Industry Stats
Stay ahead with the latest trends and market analysis.

The global carbonated beverage market size reached a value of approximately USD 526.77 Billion in 2025. The market is projected to grow at a CAGR of 5.30% between 2026 and 2035, reaching a value of around USD 882.89 Billion by 2035. The steady rise of the carbonated beverage market is supported by changing consumer lifestyles and an expanding global preference for refreshing, ready-to-drink products. Manufacturers are focusing on cleaner ingredient profiles, innovative flavors, and health-forward formulations to appeal to a wider audience. The shift toward premium and craft-style fizzy beverages has also opened new growth avenues, especially among younger consumers seeking unique taste experiences.
Base Year
Historical Period
Forecast Period
As per ABS, 14.8 million tonnes of food and non-alcoholic beverages have been consumed in Australia in 2022-2023.
According to the Eurostat, there have been 2,91,000 food and beverage processing enterprises in the EU in 2020.
As per Eurostat, in 2022, the value of soft drinks produced in Europe has been estimated to be €30.0 billion.
Compound Annual Growth Rate
5.3%
Value in USD Billion
2026-2035
*this image is indicative*
| Global Carbonated Beverage Market Report Summary | Description | Value |
| Base Year | USD Billion | 2025 |
| Historical Period | USD Billion | 2019-2025 |
| Forecast Period | USD Billion | 2026-2035 |
| Market Size 2025 | USD Billion | 526.77 |
| Market Size 2035 | USD Billion | 882.89 |
| CAGR 2019-2025 | Percentage | XX% |
| CAGR 2026-2035 | Percentage | 5.30% |
| CAGR 2026-2035 - Market by Region | Latin America | 5.5% |
| CAGR 2026-2035 - Market by Country | India | 6.9% |
| CAGR 2026-2035 - Market by Country | China | 5.7% |
| CAGR 2026-2035 - Market by Distribution Channel | Online Stores | 8.1% |
| CAGR 2026-2035 - Market by Type | Diet | 6.1% |
| Market Share by Country 2025 | Brazil | 2.9% |
Carbonated beverages are generally sweet and non-alcoholic. Some examples of such beverages are soft drinks, and sparkling water or seltzer water. In 2020, individuals in the EU spent €1,461 billion on food and drinks significantly elevating the consumption in the carbonated beverages market.
According to the data from Eurostat, the food and drink industry in France, Italy, and Spain have generated revenue of around €212.2 billion, €143.8 billion, and €127.5 billion respectively in 2020.
Read more about this report - REQUEST FREE SAMPLE COPY IN PDF
The growing need for ready-to-drink beverages, rising health consciousness, increasing investments in product marketing, and growing innovation in product flavours are the major trends impacting global carbonated beverage market growth.
The increasing need for convenience and accessibility among individuals grows demand for ready-to-drink (RTD) beverages as they expand their convenience catering to their needs and preferences.
Market growth is fueled by new product launches like diet, sugar-free, and zero-calorie drinks, driven by increased demand among young and health-conscious consumers.
Investments in marketing boost the carbonated beverage market by enhancing brand visibility, consumer demand, and differentiation, particularly with health and sustainability-focused campaigns.
Increasing innovation in product flavours can boost the carbonated beverage market by attracting new consumers and refreshing existing ones while catering to the preferences of consumers.
Evolving consumer preferences broaden the appeal of carbonated beverages, attracting new consumers and increasing market demand, incorporating functional ingredients appeals to health-conscious consumers seeking beverages with added benefits beyond refreshment. Embracing natural and organic ingredients caters to consumers' preferences for healthier and more transparent product formulations.
The shift towards sustainable packaging reflects growing environmental concerns and resonates with eco-conscious consumers, contributing to brand loyalty. Additionally, the availability of carbonated beverages in convenient packaging formats such as single-serve bottles, cans, or pouches enhances accessibility and meets the needs of on-the-go consumers, further stimulating market demand.
Read more about this report - REQUEST FREE SAMPLE COPY IN PDF
“Carbonated Beverage Market Report and Forecast 2026-2035” offers a detailed analysis of the market based on the following segments:
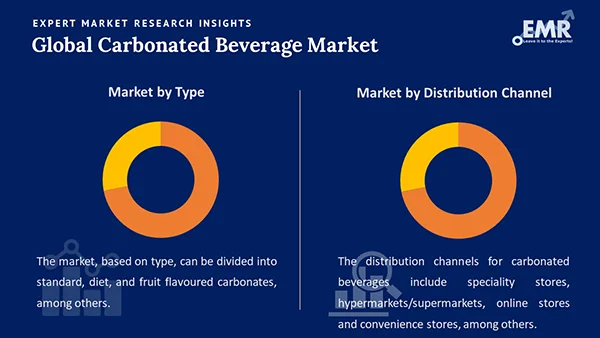
Market Breakup by Type
Market Breakup by Distribution Channel
Market Breakup by Region
| CAGR 2026-2035 - Market by | Country |
| India | 6.9% |
| China | 5.7% |
| Mexico | 5.3% |
| Canada | 5.1% |
| Germany | 4.5% |
| USA | XX% |
| UK | XX% |
| France | XX% |
| Italy | 4.1% |
| Japan | XX% |
| Australia | XX% |
| Saudi Arabia | XX% |
| Brazil | XX% |


The Asia Pacific region is projected to experience significant growth due to rising consumer disposable incomes and its large population. This growth will significantly boost the global carbonated beverage market size, as more consumers can afford and consume these products.
Major industry players are investing more to expand their consumer base in India and China, which is expected to significantly drive market growth as by reaching more consumers in these populous countries.
The increasing penetration of the e-commerce industry and the growing consumer preference for online shopping elevate the market demand.
Online channels offer expanded reach, direct consumer engagement, convenience, personalized marketing, and competitive e-commerce platforms. They drive market growth by reaching wider audiences, fostering brand loyalty, facilitating convenient purchases, tailoring marketing efforts, and encouraging innovation and competition.
Consumers prefer online channels for buying carbonated beverages due to their convenience, accessibility to diverse options, time-saving nature, personalised recommendations, access to reviews, promotional offers, and contactless shopping benefits, especially amid health concerns.
Based on type, diet beverages are gaining traction among individuals as it provides various health benefits significantly driving the carbonated beverages market growth.
Diet beverages are favoured for their reduced calorie count, making them attractive to health-conscious individuals seeking flavoured drinks without extra sugar or calories. They are especially popular with those focused on weight management.
The companies manufacture, sell, and market other non-alcoholic beverage concentrates, syrups, and alcoholic beverages, and operate across all facets of the food and beverage industry.
Tracing its roots to 1892, The Coca-Cola Company, headquartered in the United States, produces Coca-Cola, and manufactures, sells, and markets other non-alcoholic beverage concentrates, syrups, and alcoholic beverages.
Founded in 1965, with its headquarters in the United States, PepsiCo Inc. is a food, snack, and beverage corporation that operates across all facets of the food and beverage industry.
Establishes in 1984, and situated in India, Parle Agro Private Limited operates under three main business segments: Beverages- fruit drinks, nectars, juice, and sparkling drinks; and Water, packaged drinking water.
Founded in 1985, with its headquarters in the United States, National Beverage Corp. develops, manufactures, and distributes flavoured soft drinks, with La Croix, Shasta, and Faygo being its most notable brands.
*Please note that this is only a partial list; the complete list of key players is available in the full report. Additionally, the list of key players can be customized to better suit your needs.*
Other global carbonated beverage market key players are Tru Blu Beverages Pty Ltd, among others.


Upto 15% Off
USD
$3999 $3599
$2499 $2249
$4999 $4249
$5999 $5099


*While we strive to always give you current and accurate information, the numbers depicted on the website are indicative and may differ from the actual numbers in the main report. At Expert Market Research, we aim to bring you the latest insights and trends in the market. Using our analyses and forecasts, stakeholders can understand the market dynamics, navigate challenges, and capitalize on opportunities to make data-driven strategic decisions.*
Get in touch with us for a customized solution tailored to your unique requirements and save upto 35%!
The market was valued at USD 526.77 Billion in 2025.
The market is projected to grow at a CAGR of 5.30% between 2026 and 2035.
The revenue generated from the carbonated beverage market is expected to reach USD 882.89 Billion in 2035.
The market is categorised according to the type, which includes standard, diet, fruit flavoured carbonates, and others.
The market key players are The Coca-Cola Company, PepsiCo Inc., Parle Agro Private Limited, National Beverage Corp., and Tru Blu Beverages Pty Ltd among others.
Based on the end use, the market is divided into hypermarkets/supermarkets, speciality stores, convenience stores, online stores, and others.
The market is broken down into North America, Europe, Asia Pacific, Latin America, and Middle East and Africa.
Explore our key highlights of the report and gain a concise overview of key findings, trends, and actionable insights that will empower your strategic decisions.
| REPORT FEATURES | DETAILS |
| Base Year | 2025 |
| Historical Period | 2019-2025 |
| Forecast Period | 2026-2035 |
| Scope of the Report |
Historical and Forecast Trends, Industry Drivers and Constraints, Historical and Forecast Market Analysis by Segment:
|
| Breakup by Type |
|
| Breakup by Distribution Channel |
|
| Breakup by Region |
|
| Market Dynamics |
|
| Competitive Landscape |
|
| Companies Covered |
|
| Report Price and Purchase Option | Explore our purchase options that are best suited to your resources and industry needs. |
| Delivery Format | Delivered as an attached PDF and Excel through email, with an option of receiving an editable PPT, according to the purchase option. |
Single User License
One User
USD 3,999
USD 3,599
tax inclusive*
Datasheet
One User
USD 2,499
USD 2,249
tax inclusive*
Five User License
Five User
USD 4,999
USD 4,249
tax inclusive*
Corporate License
Unlimited Users
USD 5,999
USD 5,099
tax inclusive*
*Please note that the prices mentioned below are starting prices for each bundle type. Kindly contact our team for further details.*
Flash Bundle
Small Business Bundle
Growth Bundle
Enterprise Bundle
*Please note that the prices mentioned below are starting prices for each bundle type. Kindly contact our team for further details.*
Flash Bundle
Number of Reports: 3
20%
tax inclusive*
Small Business Bundle
Number of Reports: 5
25%
tax inclusive*
Growth Bundle
Number of Reports: 8
30%
tax inclusive*
Enterprise Bundle
Number of Reports: 10
35%
tax inclusive*
How To Order

Select License Type
Choose the right license for your needs and access rights.

Click on ‘Buy Now’
Add the report to your cart with one click and proceed to register.

Select Mode of Payment
Choose a payment option for a secure checkout. You will be redirected accordingly.
Gain insights to stay ahead and seize opportunities.

Get insights & trends for a competitive edge.

Track prices with detailed trend reports.

Analyse trade data for supply chain insights.

Leverage cost reports for smart savings

Enhance supply chain with partnerships.

Connect For More Information
Our expert team of analysts will offer full support and resolve any queries regarding the report, before and after the purchase.
Our expert team of analysts will offer full support and resolve any queries regarding the report, before and after the purchase.
We employ meticulous research methods, blending advanced analytics and expert insights to deliver accurate, actionable industry intelligence, staying ahead of competitors.
Our skilled analysts offer unparalleled competitive advantage with detailed insights on current and emerging markets, ensuring your strategic edge.
We offer an in-depth yet simplified presentation of industry insights and analysis to meet your specific requirements effectively.


Share