

Consumer Insights
Uncover trends and behaviors shaping consumer choices today
Procurement Insights
Optimize your sourcing strategy with key market data
Industry Stats
Stay ahead with the latest trends and market analysis.

The global canned tuna market size reached USD 24.61 Billion in 2025, reflecting steady market performance across regions. This market is projected to grow further at a CAGR of 3.91% during the forecast period of 2026-2035, eventually reaching a value of approximately USD 36.11 Billion by 2035. Market dynamics are driven by increasing demand for convenient protein sources, with consumers prioritising health and shelf-stable options. Leading manufacturers focus on sustainable fishing practices and product innovation to meet evolving consumer preferences and ensure continued market growth in the coming years.
Base Year
Historical Period
Forecast Period
In 2021, 6,355 KMT of tuna was produced globally.
Thailand and Indonesia are major exporters of processed canned tuna.
Canned tuna is increasingly being preferred over fresh tuna due its convenience, extended shelf life, and economic benefits.
Compound Annual Growth Rate
3.91%
Value in USD Billion
2026-2035
*this image is indicative*
Read more about this report - REQUEST FREE SAMPLE COPY IN PDF
The canned tuna market is experiencing steady growth due to increasing demand for packaged food and canned foods. As consumers seek easy consumption options, ready-to-cook meals have gained popularity. Canned tuna, being one of the leading convenience food products, supports the growth of this market through its accessibility and versatility. In December 2024, Simak, owned by Fisheries Development Oman, officially launched its first line of commercial canned tuna products. Sharing articles without permission breached the terms and conditions of the site. Readers were advised to use official sharing tools or contact the publication for expanded access and further information via their website.
Read more about this report - REQUEST FREE SAMPLE COPY IN PDF
Growing Consumer Reliance on Ready-to-Cook and Ready-to-Eat Foods to Support Market Growth
The global canned tuna market is witnessing steady growth, driven by rising demand for ready-to-cook and ready-to-eat food products. With convenience becoming a priority for busy consumers, especially millennials, canned foods like wild-caught tuna have gained significant traction. Millennials prefer nutritious, time-saving options, making tuna a staple in modern diets. As a result, manufacturers are innovating packaging and recipes to cater to this evolving demographic. The versatility of tuna in salads, sandwiches, and hot meals further strengthens its appeal, positioning it as a key player in the growing landscape of convenient food products. In January 2025, Chicken of the Sea expanded its on-the-go product line by launching wild-caught tuna with McCormick’s OLD BAY and Chili Lime seasonings. These ready-to-eat offerings cater to consumers seeking convenient, mess-free, and flavourful snacks. Building on its 2023 success, Chicken of the Sea continues to innovate, meeting the demand for quick, nutritious meal options.
Expanding E-Commerce Platforms to Drive Market Growth
The global canned tuna market is increasingly benefiting from the expansion of e-commerce channels, making it easier for consumers to purchase processed food products online. As demand for convenient online food shopping grows, e-commerce platforms are becoming critical in reaching wider audiences. The shift towards digital purchasing has also led to adjustments in supply chain strategies, enabling more efficient distribution of canned tuna. The food industry continues to adapt, with e-commerce playing a pivotal role in the market’s growth and in meeting the changing preferences of modern consumers.
The canned tuna market has seen significant growth, driven by the demand for convenient processed food products. During the COVID-19 pandemic, consumers increasingly turned to canned products for their long shelf life and ease of use. Both supermarkets and physical stores, along with e-commerce channels, played key roles in distribution. In January 2025, U.S. grocery chains launched seafood promotions to promote healthy eating. Natural Grocers offered free cans of its own-brand tuna or sardines with purchases, aiming to encourage nutritious choices as part of their “Resolution Reset Week” event.
Rising Demand for Plant-Based Food Products to Challenge Market Growth
The global canned tuna market is experiencing a shift as the demand for plant-based food products continues to rise. Consumers are increasingly opting for vegan alternatives, driven by health and environmental concerns. Plant-based food products, such as plant-based tuna, are becoming more popular, which has impacted the market growth of traditional products like canned tuna. As the market growth of plant-based options accelerates, manufacturers in the canned tuna sector face pressure to innovate and offer alternatives that cater to evolving consumer preferences. This trend is expected to shape the future of the canned tuna market in the coming years. In January 2023, Israeli manufacturer Vgarden launched a 100% vegan tinned tuna for the B2B market. Made with pea protein, fibres, and sunflower oil, it mimics the texture and flavour of traditional tuna. Vgarden aims to address sustainability concerns and overfishing while offering a plant-based alternative.
Introduction of Flavoured Product to Provide Growth Opportunities
Flavoured canned tuna products are gaining popularity in the global market, driven by increasing consumer demand for innovative canned seafood options. Product innovation in the form of new flavours offers brands an opportunity to differentiate and appeal to a wider audience. By introducing these innovative products, manufacturers can potentially generate higher profits, enhancing market growth and ensuring a competitive edge in the evolving food sector.
The global canned tuna market is seeing innovative product developments. Manufacturers are exploring new methods to meet evolving market demands. The market continues to grow due to increasing consumer preference for convenient seafood options.
Mislabeling of Canned Tuna Products to Undermine Consumer Trust in Products
The canned tuna market faces significant challenges due to adulteration, which can severely affect consumer trust. Mislabeling of tuna species, including pseudotuna, bullet tuna, frigate tuna, skipjack, and albacore, has become a growing concern. As the global population increases, the demand for canned tuna rises, but issues like mislabelling and adulteration could undermine the market's reputation. Addressing these concerns is essential for sustainable growth. A Canadian study revealed high seafood mislabeling rates in Calgary, including endangered species sold under vague names. Adulteration and ambiguous market labels obscured tuna species and conservation concerns. Researchers urged clearer labelling and regulations to protect marine biodiversity and guide consumer choices.
Rising Inclusion of Nutrient-Rich Foods in Daily Diets to Support Market Growth
The rising demand for high-nutrition foods is driving market growth in the global canned tuna industry. As more consumers incorporate tuna into their daily diets, its value as a source of protein and essential fatty acids becomes clear. The consumption of tuna, particularly in processed products, is helping meet nutritional requirements and fuelling market growth as people seek healthier, high-nutrition foods. In November 2021, John West launched a nutrient-rich canned tuna range to meet rising demand for healthy, functional foods. The range included variants supporting energy, heart health, and immunity. Aimed at younger, health-conscious consumers, the launch highlighted wellness as a key driver of market innovation and reinforced the brand’s commitment to health and everyday convenience.
The COVID-19 pandemic significantly influenced the global canned tuna market, driving a surge in demand for processed food. During lockdown, consumers increasingly relied on convenient processed food products. Improved purchasing power in some regions also boosted sales performance, as processed food remained a staple choice for households adapting to restricted access and limited fresh options. The Pacific tuna industry faced disruption from COVID-19 due to restricted port access, halted observer requirements, and processing delays from labour shortages. While demand for canned tuna increased, longline sales dropped. Local firms coped better, emphasising self-sufficiency, remote monitoring, and sustainability for future industry stability.
The global canned tuna market has seen strong demand due to rising interest in convenient food products. As consumers increasingly opt for packaged food, canned food stands out for its shelf life and ease of use. Food products like canned tuna are driving market growth, offering both convenience and reliability in meeting everyday dietary needs.
Read more about this report - REQUEST FREE SAMPLE COPY IN PDF
Skipjack Segment Dominates Market Share Due to Greater Availability
Skipjack tuna is the most used species in the global canned tuna market due to its abundance and cost-effectiveness. It offers a rich source of protein and omega-3 fatty acids, making it a popular choice for health-conscious consumers. Skipjack’s mild flavour and firm texture make it versatile for various canned food products. In 2023, the commercial landings of Pacific skipjack tuna reached 245,000 pounds, with a total value of USD 720,000, as reported by the NOAA Fisheries commercial fishing landings database.
Albacore tuna is prized for its higher fat content, making it a preferred option for premium canned tuna products. Known for its mild, delicate flavour and firm texture, albacore is often marketed as "white tuna," offering a more refined taste. Rich in protein, omega-3 fatty acids, and other essential nutrients, albacore appeals to health-conscious consumers. Although more expensive than skipjack, its premium quality justifies its value, supporting its continued demand in the global canned tuna market.
Canned Light Segment Leads the Market Due to Its Health Benefits
Canned white tuna, often referred to as albacore, is a premium product in the global canned tuna market. It is prized for its mild flavour, firm texture, and lighter colour, making it a popular choice for consumers seeking a more delicate taste. Rich in protein and omega-3 fatty acids, white tuna provides numerous health benefits, including supporting heart health and brain function. It is a great source of essential nutrients, including selenium and vitamin D, which are vital for immune health. While it tends to be more expensive than other tuna varieties, its high quality and nutritional profile justify its appeal, particularly among health-conscious consumers seeking a nutritious, low-fat protein source.
Canned light tuna, typically made from skipjack, is the most widely consumed type of canned tuna due to its affordability and health benefits. Rich in protein, omega-3 fatty acids, and essential vitamins, light tuna supports heart health, reduces inflammation, and boosts brain function. It is low in fat and calories, making it an ideal choice for those aiming to maintain a healthy diet. Its mild flavour and versatility make it suitable for various dishes, from salads to sandwiches. In February 2025, EROSKI launched Spain's first own-brand canned light tuna with MSC certification, emphasising sustainable fishing. This move, part of their commitment to quality and ocean preservation, expanded their MSC product range to 35, reinforcing their leadership in the sector.
Oil Segment Captures Largest Market Share Due to Enhanced Flavour Profile
Water and brine-packed tuna is a healthier option, being lower in calories and fat compared to oil-packed alternatives. This makes it an ideal choice for health-conscious consumers looking to manage their calorie intake. In 2023, the Tonnara Florio, established in 1859, revolutionised canned tuna production by introducing the process of preserving tuna in oil. The facility, now a museum, showcased its historical significance and contribution to global canned fish, ensuring long shelf life and enhancing food security, especially in Africa and the Mediterranean.
Oil-packed tuna is renowned for its enhanced flavour, providing a richer, more indulgent taste. The oil helps to preserve the tuna’s moisture, ensuring a tender and juicy texture. Additionally, oil-packed tuna has a longer shelf life, making it a convenient and durable option. The added oil also contributes to healthy fats, such as omega-3 fatty acids, which are beneficial for heart health. This variant caters to consumers seeking a more flavourful and satisfying tuna product.
Chunks Segment Dominates the Market Due to Its Attractive Size
Flakes of canned tuna offer convenience and versatility for consumers, making them ideal for quick meal preparations. They provide a soft texture and are perfect for salads, sandwiches, or pasta dishes. Rich in protein and omega-3 fatty acids, flakes offer numerous health benefits, including improved heart health. Their easy-to-use packaging and long shelf life contribute to the growing demand in the global canned tuna market, especially for busy consumers seeking healthy, ready-to-eat options.
Chunks of canned tuna are popular for their hearty, meaty texture, making them suitable for a wide range of recipes. They are highly valued for their rich protein content and omega-3 fatty acids, which support muscle growth and cardiovascular health. In January 2024, Tonnino launched Tonnino Kids Tuna in two varieties, designed for children with bright packaging and kid-friendly flavours. Bertolli introduced a new range of Mediterranean table olives in the US, while All Y’alls Foods expanded its plant-based jerky range with a Cinnamon Churro flavour.
Retail Segment Leads the Market Due to Its Cost-Effectiveness
The foodservice segment plays a vital role in the global canned tuna market, providing significant advantages for both businesses and consumers. Canned tuna is a convenient, cost-effective, and nutritious option for restaurants, cafes, and catering services. It offers long shelf-life, reducing wastage and allowing for better stock management. Due to its versatility, it can be used in a wide variety of dishes, including salads, sandwiches, pasta, and sushi. The high protein content, omega-3 fatty acids, and ease of preparation make it a popular choice for health-conscious consumers. Moreover, with the increasing demand for quick meal solutions, canned tuna meets the needs of fast-paced foodservice operations. As the market continues to grow, the foodservice industry’s reliance on canned tuna will likely increase, driven by cost efficiency and sustainable sourcing practices.
In the retail sector, canned tuna has established itself as a popular, affordable, and convenient product. With increasing consumer demand for easy-to-prepare meals, canned tuna provides a quick and nutritious solution, making it a staple in many households. Its long shelf life and variety of packaging options, such as cans, pouches, and multi-packs, enhance its appeal in grocery stores and supermarkets. Retailers benefit from the steady demand for canned tuna, which provides consistent sales, especially in times of economic uncertainty, as it remains a low-cost protein option. Bumble Bee Seafoods expanded its U.S. retail range in 2023 with 12 new canned, pouch, and kit-based tuna products. These included premium Yellowfin varieties, kid-friendly snacks, and MSC-certified options, offering greater variety, flavour, and value to consumers.


Europe benefits significantly in the global canned tuna market due to high consumer demand for convenient, protein-rich, and sustainable food options. The region's strong emphasis on traceability and eco-certification, such as MSC labels, enhances consumer trust. Additionally, widespread availability across supermarkets and the popularity of Mediterranean diets further drive sales. In March 2024, Next Tuna, a German firm, addressed tuna sustainability by developing floating recirculating aqua systems. With support from BlueInvest and partners, they advanced Atlantic bluefin tuna reproduction, aiming to commercialise eco-friendly aquaculture and revive Europe’s tuna industry.
In North America, the canned tuna market experienced steady growth, with the United States being a major consumer. The region's preference for convenient, long-shelf-life foods contributed to the demand for canned tuna. Health-conscious consumers were increasingly drawn to tuna's nutritional benefits, including high potassium and vitamin content. The market was characterised by consolidation, with major retailers like Walmart and Costco playing significant roles. Additionally, the rise of e-commerce platforms provided new avenues for product distribution. While the market faced challenges such as price sensitivity and competition from other protein sources, innovations in packaging and product offerings, like flavoured and pouch formats, helped maintain consumer interest. The North American market is expected to continue its growth trajectory, driven by these evolving consumer preferences and distribution strategies.
The Asia Pacific region demonstrated robust growth in the canned tuna market, with countries like Japan, China, and Indonesia leading in both consumption and production. The region's diverse culinary traditions incorporated canned tuna into various dishes, enhancing its popularity. Economic development and urbanisation contributed to increased demand, as consumers sought convenient and nutritious food options. The Investors’ Meet 2024 in Andaman & Nicobar Islands promoted tuna investment opportunities, highlighting untapped potential, export growth, and infrastructure plans to position the region as a tuna fisheries export hub.
In the global canned tuna market, Latin America and the Middle East & Africa benefit from growing urbanisation, rising health awareness, and increased demand for affordable protein sources. In Latin America, strong fishing industries support local economies, while in the Middle East & Africa, expanding retail networks and changing dietary habits have driven consumption. Canned tuna’s long shelf life and nutritional value make it an attractive option across both regions.
Top Companies Prioritised New Product Launches to Drive Growth in the Canned Tuna Sector
Key market players have been concentrating on introducing innovative and exotic seafood options to meet the growing consumer demand for diverse and flavourful canned tuna products. These companies have actively collaborated with seasoning and ingredient manufacturers to create unique product offerings that appeal to evolving taste preferences. Among the most prominent firms operating in the global canned tuna industry were Bolton Group, Century Pacific Foods Inc., Grupo Albacora S.A., Thai Union Group PCL, Bumble Bee Foods LLC, American Tuna Inc., Ocean, and StarKist Co. Their efforts supported market expansion through differentiated products and strengthened their competitive positioning.
Bolton Group, Century Pacific Foods Inc., Grupo Albacora S.A., Bumble Bee Foods LLC, and Thai Union Group Inc. were among the leading companies in the industry. The global canned tuna market remained semi-fragmented, with these top five players collectively holding approximately 40% of the overall market share.
There is a considerable opportunity for both established manufacturers and new entrants to introduce innovative products in this segment. The rising popularity of cross-cultural food trends is anticipated to drive the global canned tuna market’s growth. With e-commerce expanding in developing economies, manufacturers have the chance to broaden their market presence in these regions and boost their overall revenue.
“Global Canned Tuna Industry Report and Forecast 2026-2035” offers a detailed analysis of the market based on the following segments:
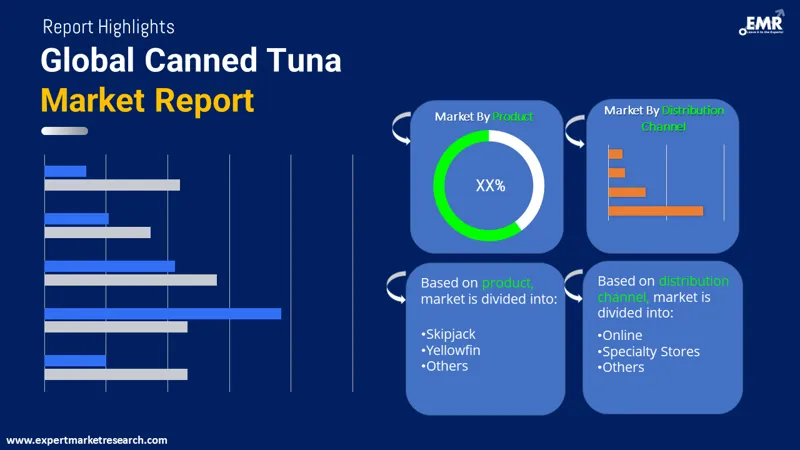
Market Breakup by Species
Market Breakup by Type
Market Breakup by Preservation Method
Market Breakup by Shape
Market Breakup by Distribution Channel
Market Breakup by Region


Upto 15% Off
USD
$2499 $2249
$3999 $3599
$4999 $4249
$5999 $5099


*While we strive to always give you current and accurate information, the numbers depicted on the website are indicative and may differ from the actual numbers in the main report. At Expert Market Research, we aim to bring you the latest insights and trends in the market. Using our analyses and forecasts, stakeholders can understand the market dynamics, navigate challenges, and capitalize on opportunities to make data-driven strategic decisions.*
Get in touch with us for a customized solution tailored to your unique requirements and save upto 35%!
In 2025, the global market canned tuna attained a value of approximately USD 24.61 Billion.
The market is estimated to grow at a CAGR of 3.91% between 2026 and 2035.
The market for canned tuna is estimated to witness a healthy growth in the forecast period of 2026-2035 to reach a value of around USD 36.11 Billion by 2035.
The major drivers of the market include the thriving food and beverage industry, rising disposable incomes, increasing population, and rapid development of supermarkets and convenience stores.
A major market trend is the growing demand for affordable, nutritious, and protein-rich food, particularly in developing economies.
The major canned tuna markets are North America, Europe, the Asia Pacific, Latin America, and the Middle East and Africa.
The significant species in the market for canned tuna include skipjack, albacore, bigeye and yellowfin, among others.
The various distribution channels of canned tuna are hypermarkets and supermarkets, speciality stores, online, and others.
The major market players are American Tuna, Inc., Thai Union Group Public Company Limited, Bumble Bee Foods, LLC, Century Pacific Food Inc., Bolton Group, Golden Prize Canning Co., Ltd., Frinsa Del Noroeste S.A., KSD Interfoods Vietnam CO., LTD, StarKist Co., Foodtech JSC, Conservas Ortiz S.A., A.E.C. Canning Company Limited, American Tuna Inc., Crown Prince Inc., Grupo Albacora SA, Wild Planet Foods Inc., Ocean's, and Dongwon Enterprise Co., Ltd., among others.
Based on type, the canned light tuna segment leads the segment.
Europe is expected to hold the highest market share.
By distribution channel, the retail segment leads the market.
Explore our key highlights of the report and gain a concise overview of key findings, trends, and actionable insights that will empower your strategic decisions.
| REPORT FEATURES | DETAILS |
| Base Year | 2025 |
| Historical Period | 2019-2025 |
| Forecast Period | 2026-2035 |
| Scope of the Report |
Historical and Forecast Trends, Industry Drivers and Constraints, Historical and Forecast Market Analysis by Segment:
|
| Breakup by Species |
|
| Breakup by Type |
|
| Breakup by Preservation Method |
|
| Breakup by Shape |
|
| Breakup by Distribution Channel |
|
| Breakup by Region |
|
| Market Dynamics |
|
| Competitive Landscape |
|
| Companies Covered |
|
Datasheet
One User
USD 2,499
USD 2,249
tax inclusive*
Single User License
One User
USD 3,999
USD 3,599
tax inclusive*
Five User License
Five User
USD 4,999
USD 4,249
tax inclusive*
Corporate License
Unlimited Users
USD 5,999
USD 5,099
tax inclusive*
*Please note that the prices mentioned below are starting prices for each bundle type. Kindly contact our team for further details.*
Flash Bundle
Small Business Bundle
Growth Bundle
Enterprise Bundle
*Please note that the prices mentioned below are starting prices for each bundle type. Kindly contact our team for further details.*
Flash Bundle
Number of Reports: 3
20%
tax inclusive*
Small Business Bundle
Number of Reports: 5
25%
tax inclusive*
Growth Bundle
Number of Reports: 8
30%
tax inclusive*
Enterprise Bundle
Number of Reports: 10
35%
tax inclusive*
How To Order

Select License Type
Choose the right license for your needs and access rights.

Click on ‘Buy Now’
Add the report to your cart with one click and proceed to register.

Select Mode of Payment
Choose a payment option for a secure checkout. You will be redirected accordingly.
Gain insights to stay ahead and seize opportunities.

Get insights & trends for a competitive edge.

Track prices with detailed trend reports.

Analyse trade data for supply chain insights.

Leverage cost reports for smart savings

Enhance supply chain with partnerships.

Connect For More Information
Our expert team of analysts will offer full support and resolve any queries regarding the report, before and after the purchase.
Our expert team of analysts will offer full support and resolve any queries regarding the report, before and after the purchase.
We employ meticulous research methods, blending advanced analytics and expert insights to deliver accurate, actionable industry intelligence, staying ahead of competitors.
Our skilled analysts offer unparalleled competitive advantage with detailed insights on current and emerging markets, ensuring your strategic edge.
We offer an in-depth yet simplified presentation of industry insights and analysis to meet your specific requirements effectively.


Share