

Consumer Insights
Uncover trends and behaviors shaping consumer choices today
Procurement Insights
Optimize your sourcing strategy with key market data
Industry Stats
Stay ahead with the latest trends and market analysis.

The Canada television market reached around USD 1.78 Billion in 2025. The market is projected to grow at a CAGR of 2.20% between 2026 and 2035, reaching almost USD 2.21 Billion by 2035.
Base Year
Historical Period
Forecast Period
Nearly 1/4th of overall viewing time on television is spent on watching streamed content.
An average Canadian aged 18 years and above watches television for 20.6 hours weekly.
Digital media broadcasting subscriptions recorded a year-on-year increase of 9.9% in Canada.
Compound Annual Growth Rate
2.2%
Value in USD Billion
2026-2035
*this image is indicative*
An average Canadian person aged 18 years and above watches 17.7 hours of live television each week, which is significantly higher than the amount of time spent watching content on different social media websites like YouTube (5 hours weekly) and Facebook (1.3 hours weekly).
Television is accessible to nearly 91.6% of the population aged above 55 years in Canada. This section of the population watches television for 37.2 hours weekly, which is significantly more than the amount of time spent by Canadians aged 25-54 years (16.6 hours weekly).
Over 40% of the Canadian population having access to cable TV subscriptions view domestic networks daily. This is significantly higher than the number of people watching news channels (36%) and US networks (25%). Nearly 24% of Canadians watch sports channels every day, while 15% watch lifestyle channels, and 13% watch speciality channels.
In 2022, overall broadcasting revenues surged by 1.2% year-on-year in Canada. Both digital media broadcasting undertakings and discretionary television reported an 11.1% and 3.4% growth in revenues, respectively. Their overall spending amounted to $5.46 billion and $4.09 billion, respectively.
The most popular television genre among Canadians was drama at 33.2% in 2022. Comedy and reality followed next, with a viewership of 15.6% and 13.2% respectively.
"Canada Television Market Report and Forecast 2026-2035" offers a detailed analysis of the market based on the following segments:
Market Breakup by Type
Market Breakup by Distribution Channel
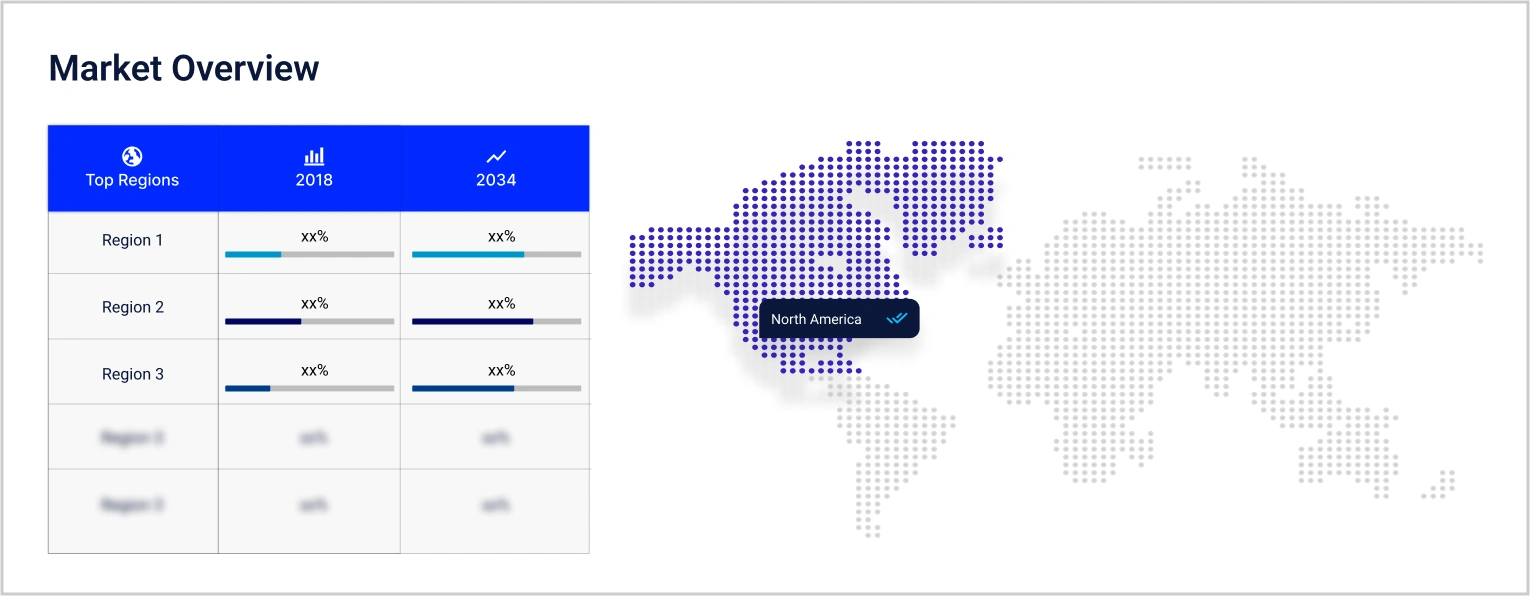
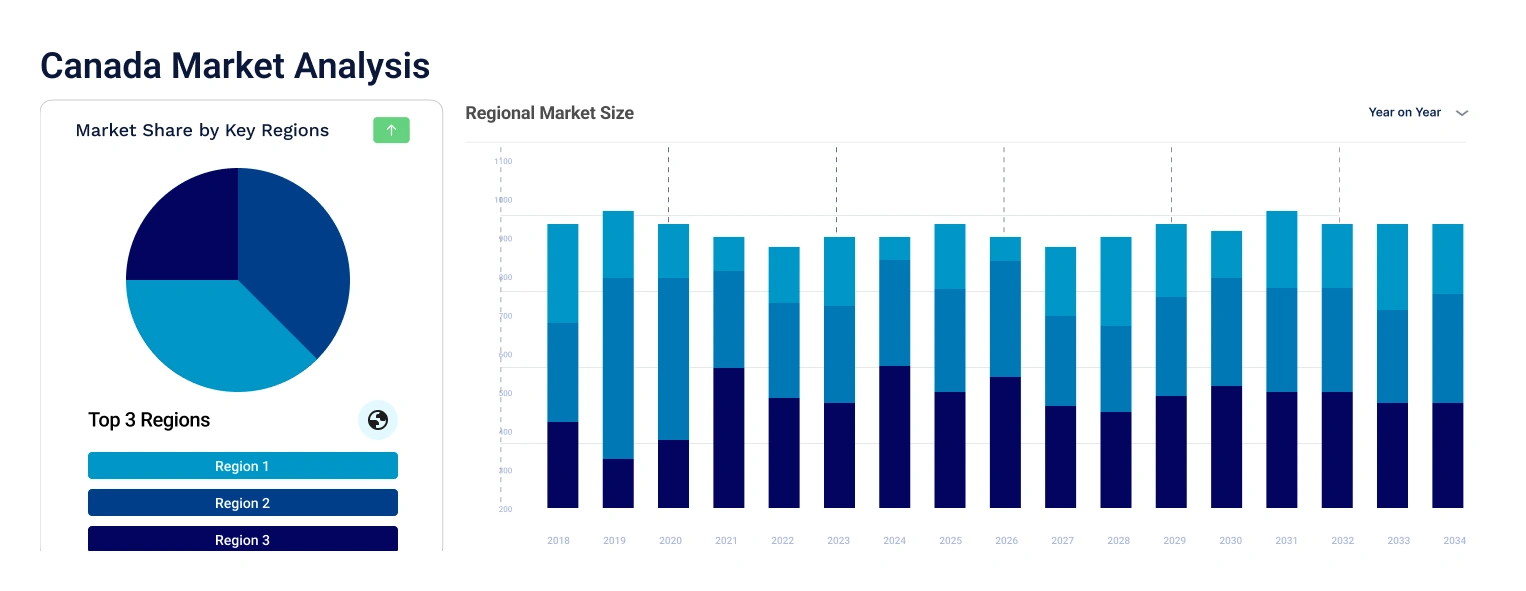
Market Breakup by Region
Based on type, the market is divided into smart TVs, LCD, plasma, and LED TVs, and cathode-ray tube (CRT) and rear-projection TVs. Over the forecast period, smart TVs are expected to emerge as one of the leading segments, as an increasing number of Canadians switch towards watching streamed content.
The report provides a detailed analysis of the following key players in the market, covering their competitive landscape and latest developments like mergers and acquisitions, investments, and capacity expansion.
With increasing viewership for OTT platforms, major companies are introducing internet-enabled smart TVs, which provide access to streaming entertainment and gaming services while delivering personalised TV show recommendations.


Upto 15% Off
USD
$3999 $3599
$2499 $2249
$4999 $4249
$5999 $5099


*While we strive to always give you current and accurate information, the numbers depicted on the website are indicative and may differ from the actual numbers in the main report. At Expert Market Research, we aim to bring you the latest insights and trends in the market. Using our analyses and forecasts, stakeholders can understand the market dynamics, navigate challenges, and capitalize on opportunities to make data-driven strategic decisions.*
Get in touch with us for a customized solution tailored to your unique requirements and save upto 35%!
The market reached nearly USD 1.78 Billion in 2025.
The market is projected to grow at a CAGR of 2.20% between 2026 and 2035.
The market is assessed to witness a healthy growth in the forecast period to reach around USD 2.21 Billion in 2035.
The different types of Televisions in the market include smart TVs, LCD, plasma, and LED TVs, and cathode-ray tube (CRT) and rear-projection TVs.
The different distribution channels of television in the market include offline and online.
The different regions covered in the market report are British Columbia, Alberta, The Prairies, Central Canada, and Atlantic Canada.
The key market players are Samsung Electronics Co., Ltd., LG Corp., Sony Group Corp., Toshiba Corporation, Hisense International Co., Ltd., Sansui Electric Co., Ltd., Vizio Holding Corp., and Hon. Hai Precision Industry Co., Ltd. (Sharp Corp.), among others.
Explore our key highlights of the report and gain a concise overview of key findings, trends, and actionable insights that will empower your strategic decisions.
| REPORT FEATURES | DETAILS |
| Base Year | 2025 |
| Historical Period | 2019-2025 |
| Forecast Period | 2026-2035 |
| Scope of the Report |
Historical and Forecast Trends, Industry Drivers and Constraints, Historical and Forecast Market Analysis by Segment:
|
| Breakup by Type |
|
| Breakup by Distribution Channel |
|
| Breakup by Region |
|
| Market Dynamics |
|
| Competitive Landscape |
|
| Companies Covered |
|
Single User License
One User
USD 3,999
USD 3,599
tax inclusive*
Datasheet
One User
USD 2,499
USD 2,249
tax inclusive*
Five User License
Five User
USD 4,999
USD 4,249
tax inclusive*
Corporate License
Unlimited Users
USD 5,999
USD 5,099
tax inclusive*
*Please note that the prices mentioned below are starting prices for each bundle type. Kindly contact our team for further details.*
Flash Bundle
Small Business Bundle
Growth Bundle
Enterprise Bundle
*Please note that the prices mentioned below are starting prices for each bundle type. Kindly contact our team for further details.*
Flash Bundle
Number of Reports: 3
20%
tax inclusive*
Small Business Bundle
Number of Reports: 5
25%
tax inclusive*
Growth Bundle
Number of Reports: 8
30%
tax inclusive*
Enterprise Bundle
Number of Reports: 10
35%
tax inclusive*
How To Order

Select License Type
Choose the right license for your needs and access rights.

Click on ‘Buy Now’
Add the report to your cart with one click and proceed to register.

Select Mode of Payment
Choose a payment option for a secure checkout. You will be redirected accordingly.
Gain insights to stay ahead and seize opportunities.

Get insights & trends for a competitive edge.

Track prices with detailed trend reports.

Analyse trade data for supply chain insights.

Leverage cost reports for smart savings

Enhance supply chain with partnerships.

Connect For More Information
Our expert team of analysts will offer full support and resolve any queries regarding the report, before and after the purchase.
Our expert team of analysts will offer full support and resolve any queries regarding the report, before and after the purchase.
We employ meticulous research methods, blending advanced analytics and expert insights to deliver accurate, actionable industry intelligence, staying ahead of competitors.
Our skilled analysts offer unparalleled competitive advantage with detailed insights on current and emerging markets, ensuring your strategic edge.
We offer an in-depth yet simplified presentation of industry insights and analysis to meet your specific requirements effectively.


Share