

Consumer Insights
Uncover trends and behaviors shaping consumer choices today
Procurement Insights
Optimize your sourcing strategy with key market data
Industry Stats
Stay ahead with the latest trends and market analysis.
The Canada computer monitor market is projected to grow at a CAGR of 3.49% between 2025 and 2034.
Base Year
Historical Period
Forecast Period
As of April 2023, the most popular resolution size for desktop computers in Canada was 1920×1080.
According to industry reports, as of October 2023, 23 million people in Canada up to the age of 65 regularly play video games. This accounts for 61% of the population.


Value in USD Billion
2025-2034
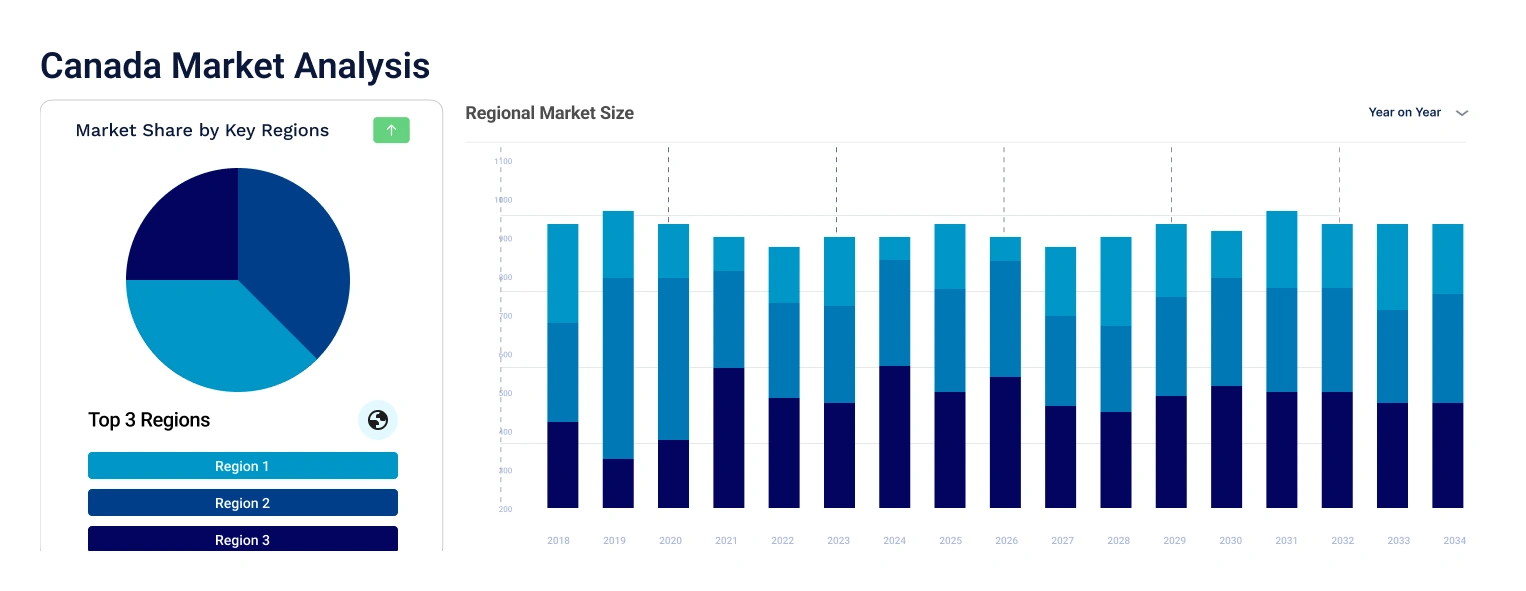
Canada Computer Monitor Market Outlook
*this image is indicative*
The growing gaming market in Canada drives the demand for computer monitors in the country. Canada currently has 937 active video gaming studios. To meet their needs, manufacturers are developing monitors with a high refresh rate, wider screen, and built-in immersive stereoscopic 3D. In April 2024, LG Electronics Canada announced new additions to its 2024 monitor lineup, which includes the UltraGear™ OLED models and MyView Smart Monitors. The 2024 LG UltraGear™ OLED gaming monitors are designed especially for gamers and e-sports athletes. These monitors deliver exceptional visual and audio performance to enhance the gaming experience of players.
As of April 20, 2024, Canada was home to a total of 2,530 Office buildings. Canadians According to the Canada computer monitor market analysis, the use of computer monitors is rising in Canadian offices to improve the productivity and comfort of workers. Compared to laptops, computer monitors are healthier from a visual perspective because the graphics and text are larger and sharper. are provided with a range of curved, touchscreen, and energy star qualified monitors with the most popular brands in the country being Dell Technologies, Lenovo, LG Electronics Inc., and Samsung Electronics Co., Ltd.
Canada Coffee Market Report and Forecast 2025-2034 offers a detailed analysis of the market based on the following segments.
Market Breakup by Type
Market Breakup by Size
Market Breakup by Application
Market Breakup by Region
Based on type, LED monitors occupy a significant share in the market. LED backlighting is used in these displays to display images. Many significant benefits come with LED backlighting, including better brightness and contrast ratios, longer lifespans, greater energy economy, and a wider color gamut. These features increase the appeal of LED monitors for a variety of applications, including gaming, consumer electronics, professional graphics design, and commercial displays.
The key players in the market are producing advanced computer monitors to enhance the experience and productivity of end users.
*While we strive to always give you current and accurate information, the numbers depicted on the website are indicative and may differ from the actual numbers in the main report. At Expert Market Research, we aim to bring you the latest insights and trends in the market. Using our analyses and forecasts, stakeholders can understand the market dynamics, navigate challenges, and capitalize on opportunities to make data-driven strategic decisions.*
Get in touch with us for a customized solution tailored to your unique requirements and save upto 35%!
The computer monitor market is expected to grow at a CAGR of 3.49% between 2025 and 2034.
A monitor is a screen designed to display information from your computer. Without a monitor, consumers wouldn't be able to see websites and documents or play games.
The display device in modern monitors is a thin film transistor liquid crystal display (TFT-LCD) with LED backlighting. These have significantly replaced cold-cathode fluorescent lamp (CCFL) backlighting.
The major drivers of the market include a growing gaming sector, a rising demand for high-end monitors in commercial establishments, and the development of advanced monitors.
Key trends aiding market expansion include the demand for innovative computer monitors with sleek designs and the popularity of video gaming.
Major countries in the market are British Columbia, Alberta, The Prairies, Central Canada, and Atlantic Canada.
Computer monitors can be small or large in size.
Key players in the market are Samsung Electronics Co., Ltd., LG Electronics Inc., ASUSTeK Computer Inc., Acer Inc., Dell Inc., Micro-Star INT'L CO., LTD., BenQ Corporation, TPV Technology Group, and others.
Explore our key highlights of the report and gain a concise overview of key findings, trends, and actionable insights that will empower your strategic decisions.
| REPORT FEATURES | DETAILS |
| Base Year | 2024 |
| Historical Period | 2018-2024 |
| Forecast Period | 2025-2034 |
| Scope of the Report |
Historical and Forecast Trends, Industry Drivers and Constraints, Historical and Forecast Market Analysis by Segment:
|
| Breakup by Type |
|
| Breakup by Size |
|
| Breakup by Application |
|
| Breakup by Region |
|
| Market Dynamics |
|
| Competitive Landscape |
|
| Companies Covered |
|
Single User License
One User
USD 3,999
USD 3,599
tax inclusive*
Datasheet
One User
USD 2,499
USD 2,249
tax inclusive*
Five User License
Five User
USD 4,999
USD 4,249
tax inclusive*
Corporate License
Unlimited Users
USD 5,999
USD 5,099
tax inclusive*
*Please note that the prices mentioned below are starting prices for each bundle type. Kindly contact our team for further details.*
Flash Bundle
Small Business Bundle
Growth Bundle
Enterprise Bundle
*Please note that the prices mentioned below are starting prices for each bundle type. Kindly contact our team for further details.*
Flash Bundle
Number of Reports: 3
20%
tax inclusive*
Small Business Bundle
Number of Reports: 5
25%
tax inclusive*
Growth Bundle
Number of Reports: 8
30%
tax inclusive*
Enterprise Bundle
Number of Reports: 10
35%
tax inclusive*
How To Order
Our step-by-step guide will help you select, purchase, and access your reports swiftly, ensuring you get the information that drives your decisions, right when you need it.

Select License Type
Choose the right license for your needs and access rights.

Click on ‘Buy Now’
Add the report to your cart with one click and proceed to register.

Select Mode of Payment
Choose a payment option for a secure checkout. You will be redirected accordingly.
Track prices with detailed trend reports.

Analyse trade data for supply chain insights.

Leverage cost reports for smart savings

Enhance supply chain with partnerships.

Gain insights to stay ahead and seize opportunities.

Get insights & trends for a competitive edge.

Track prices with detailed trend reports.
Analyse trade data for supply chain insights.
Leverage cost reports for smart savings
Enhance supply chain with partnerships.
Gain insights to stay ahead and seize opportunities.
Get insights & trends for a competitive edge.
Track prices with detailed trend reports.
Analyse trade data for supply chain insights.
Connect For More Information
Our expert team of analysts will offer full support and resolve any queries regarding the report, before and after the purchase.
Our expert team of analysts will offer full support and resolve any queries regarding the report, before and after the purchase.
We employ meticulous research methods, blending advanced analytics and expert insights to deliver accurate, actionable industry intelligence, staying ahead of competitors.
Our skilled analysts offer unparalleled competitive advantage with detailed insights on current and emerging markets, ensuring your strategic edge.
We offer an in-depth yet simplified presentation of industry insights and analysis to meet your specific requirements effectively.
Australia
63 Fiona Drive, Tamworth, NSW
+61-448-061-727
India
C130 Sector 2 Noida, Uttar Pradesh 201301
+91-723-689-1189
Philippines
40th Floor, PBCom Tower, 6795 Ayala Avenue Cor V.A Rufino St. Makati City,1226.
+63-287-899-028, +63-967-048-3306
United Kingdom
6 Gardner Place, Becketts Close, Feltham TW14 0BX, Greater London
+44-753-713-2163
United States
30 North Gould Street, Sheridan, WY 82801
+1-415-325-5166
Vietnam
193/26/4 St.no.6, Ward Binh Hung Hoa, Binh Tan District, Ho Chi Minh City
+84-865-399-124
United States (Head Office)
30 North Gould Street, Sheridan, WY 82801
+1-415-325-5166
Australia
63 Fiona Drive, Tamworth, NSW
+61-448-061-727
India
C130 Sector 2 Noida, Uttar Pradesh 201301
+91-723-689-1189
Philippines
40th Floor, PBCom Tower, 6795 Ayala Avenue Cor V.A Rufino St. Makati City, 1226.
+63-287-899-028, +63-967-048-3306
United Kingdom
6 Gardner Place, Becketts Close, Feltham TW14 0BX, Greater London
+44-753-713-2163
Vietnam
193/26/4 St.no.6, Ward Binh Hung Hoa, Binh Tan District, Ho Chi Minh City
+84-865-399-124


Share