

Consumer Insights
Uncover trends and behaviors shaping consumer choices today
Procurement Insights
Optimize your sourcing strategy with key market data
Industry Stats
Stay ahead with the latest trends and market analysis.

The Canada chiller market reached around USD 155.24 Million in 2025. The market is projected to grow at a CAGR of 3.80% between 2026 and 2035, reaching almost USD 225.41 Million by 2035.
Base Year
Historical Period
Forecast Period
As per Statistics Canada, 64% of Canadian households owned air conditioning systems in 2021.
Around 55% of carbon emissions in Vancouver come from heating buildings with natural gas.
Eco-friendly chillers are expected to witness a surge in sales over the forecast period.
Compound Annual Growth Rate
3.8%
Value in USD Million
2026-2035
*this image is indicative*
| Canada Chiller Market Report Summary | Description | Value |
| Base Year | USD Million | 2025 |
| Historical Period | USD Million | 2019-2025 |
| Forecast Period | USD Million | 2026-2035 |
| Market Size 2025 | USD Million | 155.24 |
| Market Size 2035 | USD Million | 225.41 |
| CAGR 2019-2025 | Percentage | XX% |
| CAGR 2026-2035 | Percentage | 3.80% |
| CAGR 2026-2035 - Market by Region | Alberta | 4.3% |
| CAGR 2026-2035 - Market by Region | British Columbia | 3.9% |
| CAGR 2026-2035 - Market by Type of Cooling | Water Cooled | 4.2% |
| CAGR 2026-2035 - Market by End Use | Chemicals and Petrochemicals | 3.9% |
| Market Share by Region | British Columbia | 21.0% |
Major Canadian universities, including the University of Windsor, are introducing emission reduction programmes to enhance the students’ on-campus experience and facilitate the achievement of national net zero goals by 2050. As a part of this plan, the installation of hybrid chillers, which run on both electricity and steam, is expected to witness a significant increase in adoption. As this can result in significant annual savings, the government of Canada is expected to incentivise such initiatives, thereby contributing to the market growth.
The food and beverage sector is expected to emerge as one of the leading end users of chillers in Canada. Major market players are introducing high-quality chillers for refrigerating wine bottles in compact spaces, including homes, restaurants, and tiny entertainment rooms. To ensure alcohol is stored at optimum temperature conditions, such chillers are integrated with LED displays and intuitive touchpad controls, which enhance the user experience and impart a visually appealing look to the machine. Customisable storage is also a key feature of such chillers and the presence of notable characteristics like secure door lock, auto defrost setting, and QR code for obtaining product information are expected to drive the consumer demand for such products in the forecast period.
Canada Chiller Market Report and Forecast 2026-2035 offers a detailed analysis of the market based on the following segments:
Market Breakup by Type of Cooling
Market Breakup by Compressor Type
Market Breakup by End Use
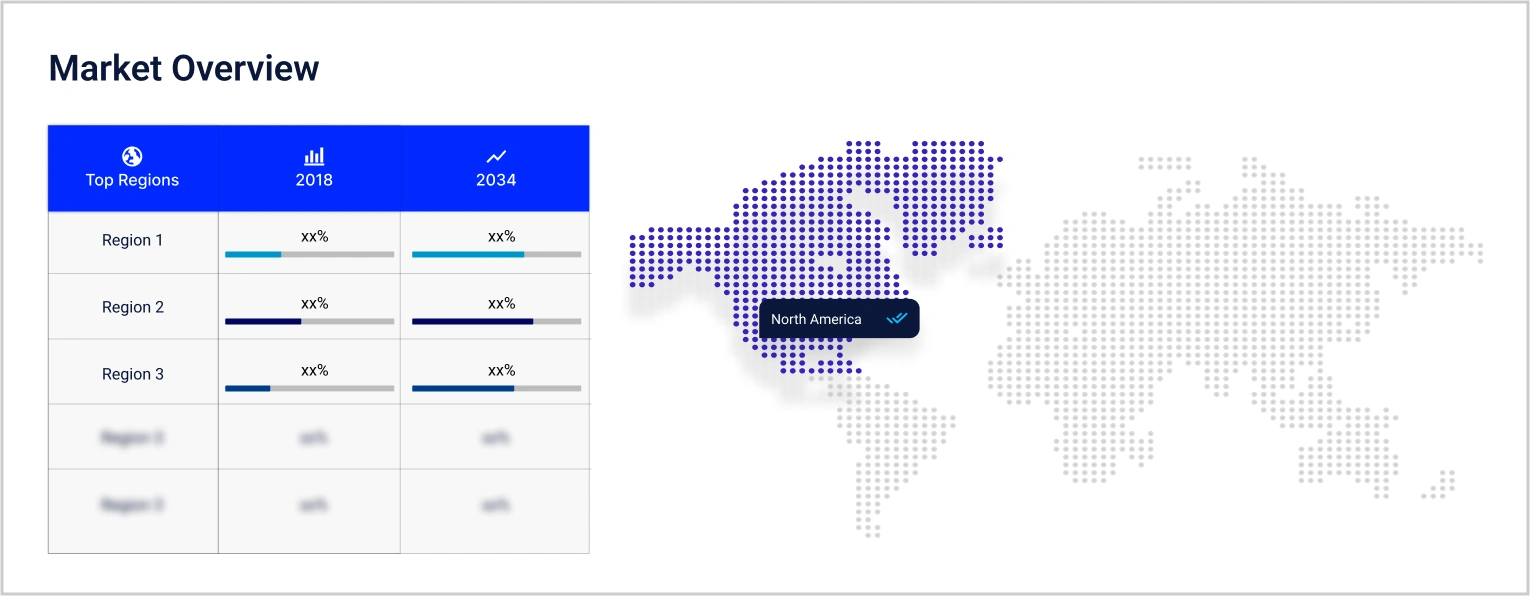
Market Breakup by Region
| CAGR 2026-2035 - Market by | Type of Cooling |
| Water Cooled | 4.2% |
| Air Cooled | XX% |
| CAGR 2026-2035 - Market by | End Use |
| Chemicals and Petrochemicals | 3.9% |
| Plastics | 3.6% |
| Food and Beverage | XX% |
| Medical and Pharmaceuticals | XX% |
| Others | XX% |
| CAGR 2026-2035 - Market by | Region |
| Alberta | 4.3% |
| British Columbia | 3.9% |
| The Prairies | XX% |
| Central Canada | XX% |
| Atlantic Canada | XX% |
Based on the type of cooling, the market is divided into water cooled and air cooled. Over the forecast period of 2026-2035, water cooled chillers are estimated to grow at a CAGR of 4.2% as they boast longer lifespan, energy efficiency, quiet operation, and safety.
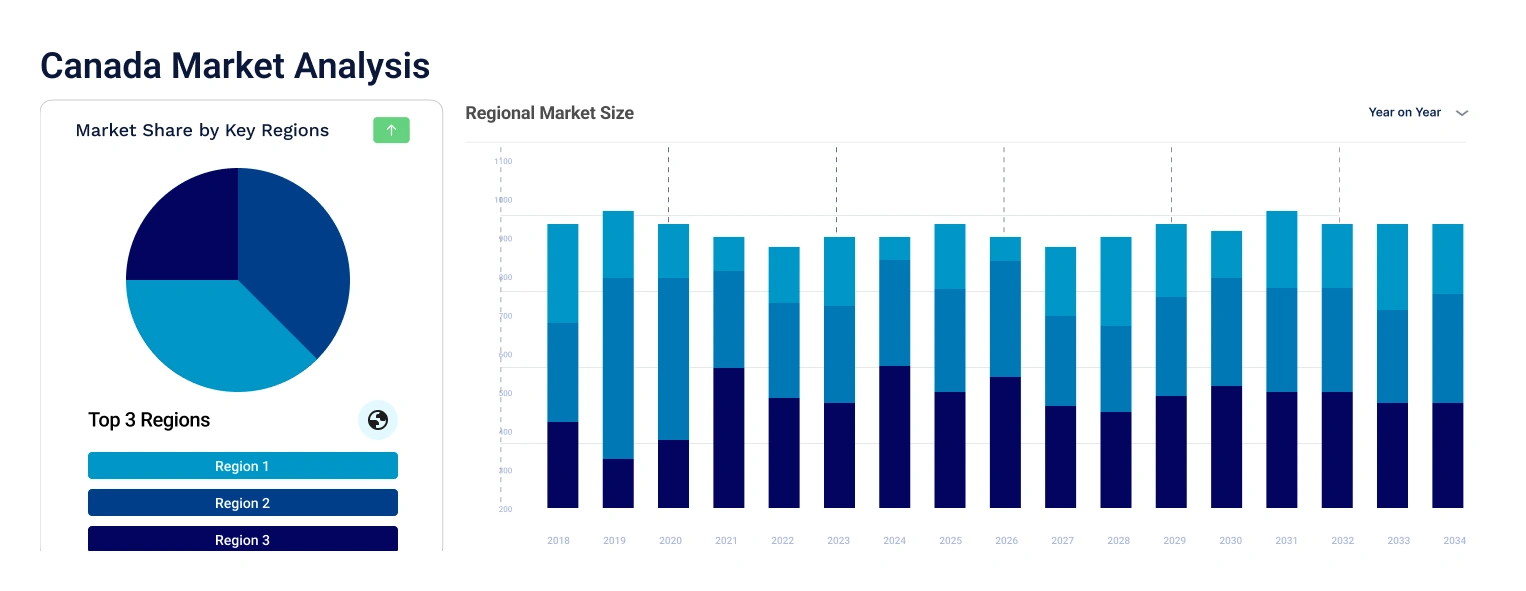
| Market Share by | Region |
| British Columbia | 21.0% |
| Alberta | XX% |
| The Prairies | XX% |
| Central Canada | XX% |
| Atlantic Canada | XX% |
Major market players are launching energy-efficient models of chillers for various commercial and residential uses.


Upto 15% Off
USD
$2499 $2249
$3999 $3599
$4999 $4249
$5999 $5099


*While we strive to always give you current and accurate information, the numbers depicted on the website are indicative and may differ from the actual numbers in the main report. At Expert Market Research, we aim to bring you the latest insights and trends in the market. Using our analyses and forecasts, stakeholders can understand the market dynamics, navigate challenges, and capitalize on opportunities to make data-driven strategic decisions.*
Get in touch with us for a customized solution tailored to your unique requirements and save upto 35%!
The market reached nearly USD 155.24 Million in 2025.
The market is projected to grow at a CAGR of 3.80% between 2026 and 2035.
The market is assessed to witness a healthy growth in the forecast period to reach around USD 225.41 Million in 2035.
The different compressor types in the market include screw chillers, scroll chillers, reciprocating chillers, centrifugal chillers, and absorption chillers.
The different end uses of compressors are food and beverage, chemicals and petrochemicals, medical and pharmaceutical, and plastics, among others.
The major segments based on types of cooling considered in the market include water cooled and air cooled.
What are the different regions covered in the market report include British Columbia, Alberta, The Prairies, Central Canada, and Atlantic Canada.
The key market players are Daikin Industries Ltd., Carrier Global Corp., LG Corp., Johnson Controls International Plc, Trane Technologies Plc, Fluid Chillers, Inc., Panasonic Holdings Corp., Mitsubishi Electric Corporation, Midea Group Co. Ltd., and HYDAC International GmbH, among others.
Explore our key highlights of the report and gain a concise overview of key findings, trends, and actionable insights that will empower your strategic decisions.
| REPORT FEATURES | DETAILS |
| Base Year | 2025 |
| Historical Period | 2019-2025 |
| Forecast Period | 2026-2035 |
| Scope of the Report |
Historical and Forecast Trends, Industry Drivers and Constraints, Historical and Forecast Market Analysis by Segment:
|
| Breakup by Type of Cooling |
|
| Breakup by Compressor Type |
|
| Breakup by End Use |
|
| Breakup by Region |
|
| Market Dynamics |
|
| Competitive Landscape |
|
| Companies Covered |
|
Datasheet
One User
USD 2,499
USD 2,249
tax inclusive*
Single User License
One User
USD 3,999
USD 3,599
tax inclusive*
Five User License
Five User
USD 4,999
USD 4,249
tax inclusive*
Corporate License
Unlimited Users
USD 5,999
USD 5,099
tax inclusive*
*Please note that the prices mentioned below are starting prices for each bundle type. Kindly contact our team for further details.*
Flash Bundle
Small Business Bundle
Growth Bundle
Enterprise Bundle
*Please note that the prices mentioned below are starting prices for each bundle type. Kindly contact our team for further details.*
Flash Bundle
Number of Reports: 3
20%
tax inclusive*
Small Business Bundle
Number of Reports: 5
25%
tax inclusive*
Growth Bundle
Number of Reports: 8
30%
tax inclusive*
Enterprise Bundle
Number of Reports: 10
35%
tax inclusive*
How To Order

Select License Type
Choose the right license for your needs and access rights.

Click on ‘Buy Now’
Add the report to your cart with one click and proceed to register.

Select Mode of Payment
Choose a payment option for a secure checkout. You will be redirected accordingly.
Gain insights to stay ahead and seize opportunities.

Get insights & trends for a competitive edge.

Track prices with detailed trend reports.

Analyse trade data for supply chain insights.

Leverage cost reports for smart savings

Enhance supply chain with partnerships.

Connect For More Information
Our expert team of analysts will offer full support and resolve any queries regarding the report, before and after the purchase.
Our expert team of analysts will offer full support and resolve any queries regarding the report, before and after the purchase.
We employ meticulous research methods, blending advanced analytics and expert insights to deliver accurate, actionable industry intelligence, staying ahead of competitors.
Our skilled analysts offer unparalleled competitive advantage with detailed insights on current and emerging markets, ensuring your strategic edge.
We offer an in-depth yet simplified presentation of industry insights and analysis to meet your specific requirements effectively.


Share