

Consumer Insights
Uncover trends and behaviors shaping consumer choices today
Procurement Insights
Optimize your sourcing strategy with key market data
Industry Stats
Stay ahead with the latest trends and market analysis.

The Brazil tea market was valued at USD 623.13 Million in 2025. The industry is expected to grow at a CAGR of 9.30% during the forecast period of 2026-2035 to attain a valuation of USD 1516.28 Million by 2035.
Base Year
Historical Period
Forecast Period
Brazilians drink an average of 10 cups of Camellia sinensis per year.
Brazil hosted Tea Culture Week from August 1-7, 2022, attended by some of the most eminent retailers, marketers, tea educators, and volunteer enthusiasts.
In August of 2023, JDE Peet’s, the top coffee and tea company globally in terms of revenue, finalised a deal to purchase Maratá’s coffee and tea operations in Brazil from JAV Group.
Compound Annual Growth Rate
9.3%
Value in USD Million
2026-2035
*this image is indicative*
| Brazil Tea Market Report Summary | Description | Value |
| Base Year | USD Million | 2025 |
| Historical Period | USD Million | 2019-2025 |
| Forecast Period | USD Million | 2026-2035 |
| Market Size 2025 | USD Million | 623.13 |
| Market Size 2035 | USD Million | 1516.28 |
| CAGR 2019-2025 | Percentage | XX% |
| CAGR 2026-2035 | Percentage | 9.30% |
| CAGR 2026-2035 - Market by Region | Minas Gerais | 8.5% |
| CAGR 2026-2035 - Market by Region | Bahia | 7.8% |
| CAGR 2026-2035 - Market by Type | Herbal Tea | 10.2% |
| CAGR 2026-2035 - Market by Distribution Channel | Online | 10.5% |
| Market Share by Region | Bahia | 4.4% |
Brazil is famous for its renowned shincha green tea, a distinction that highlights the country's unique tea market. This exceptional green tea is cultivated in the Yamamotoyama Brazilian tea gardens, which are situated in two highland regions in the central part of the country. These gardens thrive at an altitude of 2,000 to 2,500 feet, where the elevation plays a crucial role in the quality of the tea produced.
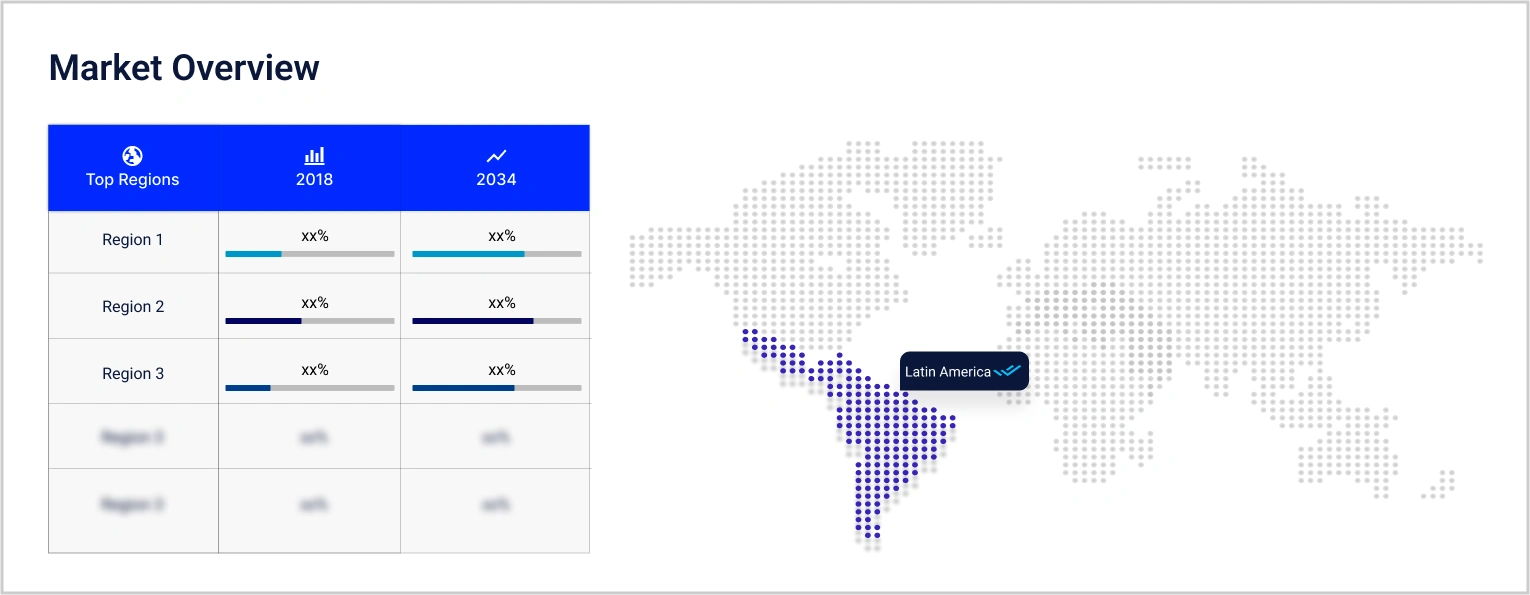
The market in Brazil is experiencing notable growth due to various factors like evolving consumer preferences, health awareness, cultural influences, and market dynamics. As the largest country in Latin America, Brazil showcases diverse tea cultures across different regions. While some areas favour all types of oolong tea, others prefer mint and lemongrass infusions. Furthermore, Yerba mate is a widely consumed tea in various parts of Brazil, known for its light and fresh taste with hints of bitterness and toastiness. With around 400 companies and 500 mate brands in the country, Brazil produces over 500 thousand tons of yerba mate annually, showing potential for further growth. Moreover, approximately 80% of this production is consumed domestically.
Moreover, the market is witnessing the trend of herbal and organic tea as consumers are increasingly becoming health-conscious and recognise the benefits of tea consumption, including antioxidants, metabolism boost, and mental well-being support.
“Brazil Tea Market Report and Forecast 2026-2035” offers a detailed analysis of the market based on the following segments:
Market Breakup by Type
Market Breakup by Form
Market Breakup by Distribution Channel
Market Breakup by Region
| CAGR 2026-2035 - Market by | Type |
| Herbal Tea | 10.2% |
| Black Tea | 8.9% |
| Green Tea | XX% |
| Others | XX% |
| CAGR 2026-2035 - Market by | Distribution Channel |
| Online | 10.5% |
| Hypermarket and Supermarket | 10.0% |
| Convenience Stores | XX% |
| Others | XX% |
| CAGR 2026-2035 - Market by | Region |
| Minas Gerais | 8.5% |
| Bahia | 7.8% |
| São Paulo | 7.0% |
| Rio de Janeiro | XX% |
| Rio Grande do Sul | XX% |
| Others | XX% |
Based on the type, black tea, green tea, and herbal tea, among others. Herbal tea is projected to grow at a CAGR of 10.2% during the forecast period of 2026-2035. Herbal teas contain high levels of antioxidants that play a crucial role in combating free radicals within the body. Free radicals are known to be unstable molecules that can result in oxidative stress and harm cells, ultimately contributing to the development of chronic illnesses and the ageing process.
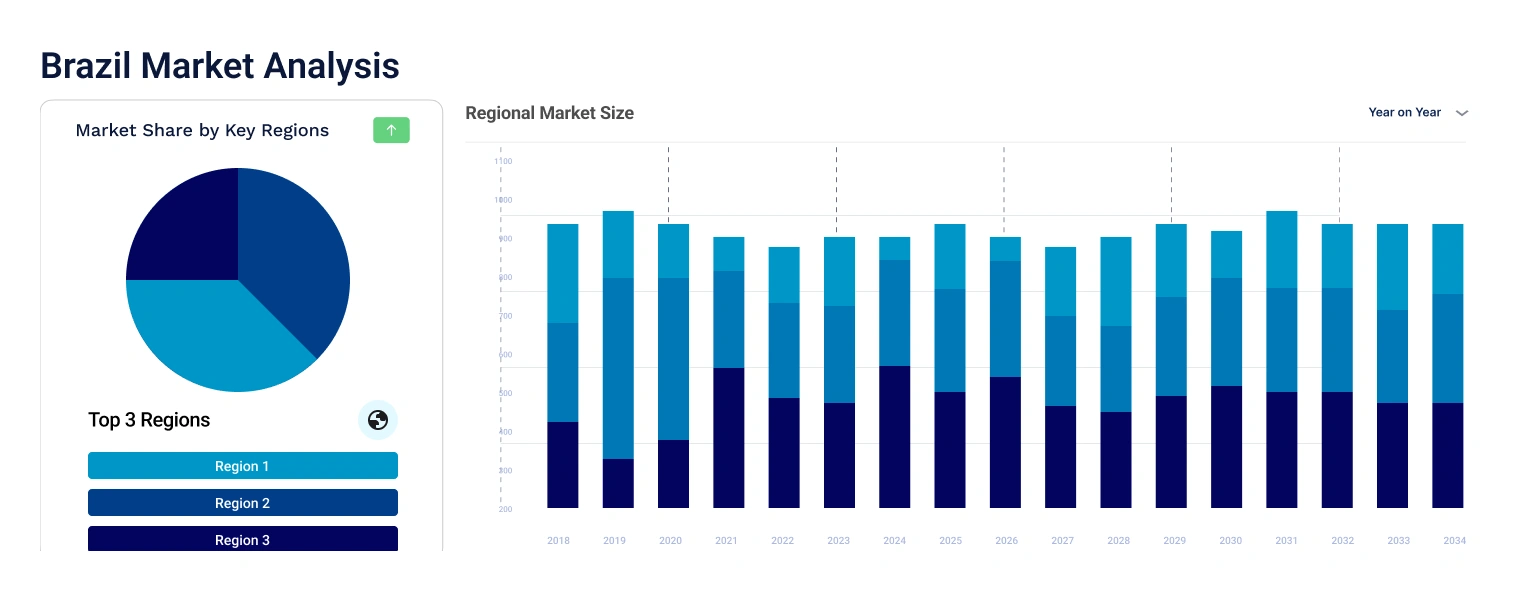
| Market Share by | Region |
| Bahia | 4.4% |
| São Paulo | XX% |
| Minas Gerais | XX% |
| Rio de Janeiro | XX% |
Major players are focusing on the production of organic and natural tea products to gain a competitive edge in the market.


Upto 15% Off
USD
$2499 $2249
$3999 $3599
$4999 $4249
$5999 $5099


*While we strive to always give you current and accurate information, the numbers depicted on the website are indicative and may differ from the actual numbers in the main report. At Expert Market Research, we aim to bring you the latest insights and trends in the market. Using our analyses and forecasts, stakeholders can understand the market dynamics, navigate challenges, and capitalize on opportunities to make data-driven strategic decisions.*
Get in touch with us for a customized solution tailored to your unique requirements and save upto 35%!
The market is estimated to grow at a CAGR of 9.30% between 2026 and 2035.
The market is being driven by changing consumer preferences and the expansion of local tea production.
The key trends aiding the market expansion include the rising demand for herbal tea and expanding e-commerce platforms.
The major regions considered in the market are São Paulo, Minas Gerais, Rio de Janeiro, Bahia, and Rio Grande do Sul.
The different forms of tea include Leaf Tea and CTC (Crush, Tear, Curl).
The major players in the market are Herboflora, HELIO AMAYA CIA LTDA, Yamamotoyama Inc., Dr. August Oetker Nahrungsmittel KG, The Coca-Cola Company (Leão), Sítio Shimada, The Mate Factor, LLC, and MB-Holding GmbH & Co. KG (Martin Bauer), among others.
In 2025, the market attained a value of nearly USD 623.13 Million.
The market is estimated to witness a healthy growth in the forecast period of 2026-2035 to reach about USD 1516.28 Million by 2035.
Explore our key highlights of the report and gain a concise overview of key findings, trends, and actionable insights that will empower your strategic decisions.
| REPORT FEATURES | DETAILS |
| Base Year | 2025 |
| Historical Period | 2019-2025 |
| Forecast Period | 2026-2035 |
| Scope of the Report |
Historical and Forecast Trends, Industry Drivers and Constraints, Historical and Forecast Market Analysis by Segment:
|
| Breakup by Type |
|
| Breakup by Form |
|
| Breakup by Distribution Channel |
|
| Breakup by Region |
|
| Market Dynamics |
|
| Competitive Landscape |
|
| Companies Covered |
|
Datasheet
One User
USD 2,499
USD 2,249
tax inclusive*
Single User License
One User
USD 3,999
USD 3,599
tax inclusive*
Five User License
Five User
USD 4,999
USD 4,249
tax inclusive*
Corporate License
Unlimited Users
USD 5,999
USD 5,099
tax inclusive*
*Please note that the prices mentioned below are starting prices for each bundle type. Kindly contact our team for further details.*
Flash Bundle
Small Business Bundle
Growth Bundle
Enterprise Bundle
*Please note that the prices mentioned below are starting prices for each bundle type. Kindly contact our team for further details.*
Flash Bundle
Number of Reports: 3
20%
tax inclusive*
Small Business Bundle
Number of Reports: 5
25%
tax inclusive*
Growth Bundle
Number of Reports: 8
30%
tax inclusive*
Enterprise Bundle
Number of Reports: 10
35%
tax inclusive*
How To Order

Select License Type
Choose the right license for your needs and access rights.

Click on ‘Buy Now’
Add the report to your cart with one click and proceed to register.

Select Mode of Payment
Choose a payment option for a secure checkout. You will be redirected accordingly.
Gain insights to stay ahead and seize opportunities.

Get insights & trends for a competitive edge.

Track prices with detailed trend reports.

Analyse trade data for supply chain insights.

Leverage cost reports for smart savings

Enhance supply chain with partnerships.

Connect For More Information
Our expert team of analysts will offer full support and resolve any queries regarding the report, before and after the purchase.
Our expert team of analysts will offer full support and resolve any queries regarding the report, before and after the purchase.
We employ meticulous research methods, blending advanced analytics and expert insights to deliver accurate, actionable industry intelligence, staying ahead of competitors.
Our skilled analysts offer unparalleled competitive advantage with detailed insights on current and emerging markets, ensuring your strategic edge.
We offer an in-depth yet simplified presentation of industry insights and analysis to meet your specific requirements effectively.


Share