

Consumer Insights
Uncover trends and behaviors shaping consumer choices today
Procurement Insights
Optimize your sourcing strategy with key market data
Industry Stats
Stay ahead with the latest trends and market analysis.

The Brazil running gear market size USD 1.75 Billion in 2025. The market is projected to grow at a CAGR of 6.30% between 2026 and 2035 to reach nearly USD 3.22 Billion by 2035.
Base Year
Historical Period
Forecast Period
Data from Brazil in 2019 indicated that approximately 4 million individuals participated in running, contributing to a market valued at around BRL 3.1 billion annually.
On average, Brazilians spend about three hours per week on physical exercise, averaging around 26 minutes each day.
As per the Brazilian Association of Street Running (ABCR), the year 2023 witnessed the organisation of 150,000 street races, reflecting a 13% rise in participant numbers in comparison to the prior year.
Compound Annual Growth Rate
6.3%
Value in USD Billion
2026-2035
*this image is indicative*
| Brazil Running Gear Market Report Summary | Description | Value |
| Base Year | USD Billion | 2025 |
| Historical Period | USD Billion | 2019-2025 |
| Forecast Period | USD Billion | 2026-2035 |
| Market Size 2025 | USD Billion | 1.75 |
| Market Size 2035 | USD Billion | 3.22 |
| CAGR 2019-2025 | Percentage | XX% |
| CAGR 2026-2035 | Percentage | 6.30% |
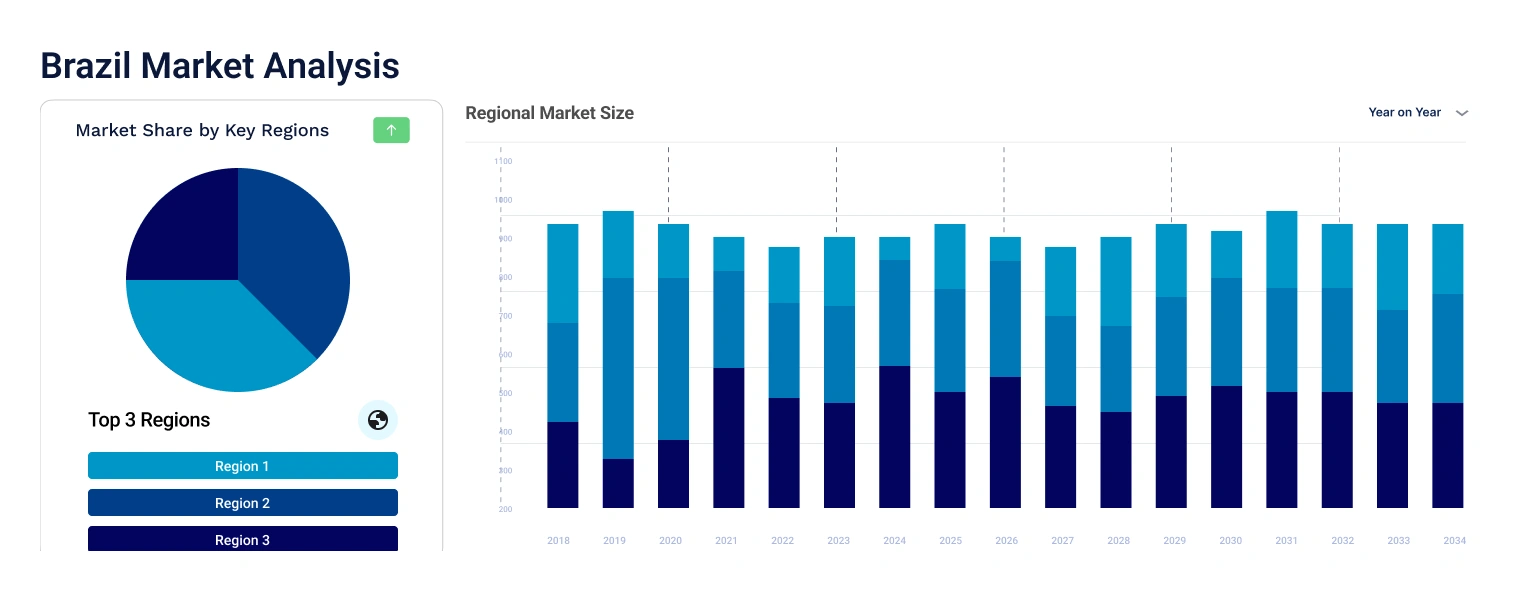
| CAGR 2026-2035 - Market by Region | Minas Gerais | 6.8% |
| CAGR 2026-2035 - Market by Region | Rio Grande do Sul | 6.5% |
| CAGR 2026-2035 - Market by Gender | Unisex | 6.9% |
| CAGR 2026-2035 - Market by Distribution Channel | Offline | 11.4% |
| 2025 Market Share by Region | Bahia | 4.1% |
The Brazilian Association of Street Running (ABCR) reports that there are currently 13 million runners in Brazil. In 2019, Brazil reported total e-commerce sales of EUR 12.5 billion, marking a 16% increase compared to the previous year. The e-commerce sector in Brazil is experiencing rapid growth, with an annual rate of 14.3%. Online platforms grant consumers convenient access to an extensive array of running gear, including footwear, clothing, and accessories, all from the comfort of their homes. This convenience is particularly attractive to busy individuals who may lack the time to shop in physical stores. Furthermore, online retailers typically provide a wider variety of running gear than traditional stores, allowing consumers to explore numerous brands, styles, and sizes to find products that best suit their needs and preferences.
The Brazil fitness tracker market, which includes well-known models such as the Apple Watch, has experienced substantial growth in recent years. As of January 2023, the market share of Apple Watch ownership in Brazil stands at 21.9%. Apple has sold 26.7 million smartwatches during the first three quarters of 2023. Fitness smartwatches are equipped with sensors that monitor a variety of activities, including steps walked, distance covered, calories burned, and active minutes. These functionalities assist users in tracking their daily physical activity and establishing goals to maintain an active lifestyle. For individuals engaged in running, cycling, and hiking, GPS capabilities are essential. This feature allows users to monitor their routes, distance, and pace independently of a smartphone, thereby facilitating performance analysis and enhancement.
Rising interest in running; growing demand for lightweight running gear; increasing focus on sustainability; and the development of smart fabrics are favouring the Brazil running gear market expansion.
With the growing environmental consciousness, sustainable fabrics such as organic cotton, recycled polyester, and bamboo that offer durability, breathability, and moisture-wicking properties are increasingly used in running gear.
Key players are increasingly using 3D printing technology to manufacture running gear, eliminate waste, improve sustainability, and lower resource consumption. The technology also enables manufacturers to remove weight from clothes, shoes, and other equipment without impacting overall durability and strength.
Manufacturers are deploying odour-control textile technology to develop products that are durable and stay fresh for long periods. Such textiles also reduce the need for washing and lower resource and energy costs associated with cleaning and maintaining textile products.
Smart fabrics that detect, measure, and respond to different situations and include tracking temperature, pressure, and other key details to better understand athletes’ health and performance are gaining popularity in running gear.
The growing prominence of the “Running Era” on social media in Brazil is aiding the market. As per the Brazilian Association of Street Running (ABCR), 150 thousand street races were held in Brazil and there was a 13% increase in the number of participants.
The rising demand for lightweight running gear that can improve performance and precision, and exemplify the balance between function and form is aiding the market expansion.
The growing trend of active lifestyles and the rising awareness regarding well-being and health are surging the demand for running gear. Running gear is designed to support the body for exercise, allow freedom of movement, provide necessary support to joints and muscles, wick away sweat, and reduce friction while regulating the body temperature. The increasing interest in running and the rising number of marathons and half-marathons are further aiding the demand for running gear.
"Brazil Running Gear Market Report and Forecast 2026-2035” offers a detailed analysis of the market based on the following segments:
Market Breakup by Product
Market Breakup by Gender
Market Breakup by Distribution Channel
Market Breakup by Region
| CAGR 2026-2035 - Market by | Region |
| Minas Gerais | 6.8% |
| Rio Grande do Sul | 6.5% |
| Bahia | 6.1% |
| São Paulo | XX% |
| Rio de Janeiro | XX% |
| Others | XX% |
Based on the distribution channel, the market is segmented into online and offline. The offline segment is projected to grow at a CAGR of 11.4% during the forecast period of 2026-2035 as these channels deliver a concrete shopping experience and frequently present opportunities for individualised service. These stores generally provide an extensive selection of items, encompassing running footwear, clothing, and various accessories.
Major players are focusing on the integration of smart technology into the running gears to gain a competitive edge in the market.
The comprehensive report looks into the macro and micro aspects of the market. The EMR report gives an in-depth insight into the market by providing a SWOT analysis as well as an analysis of Porter’s Five Forces model.


Upto 15% Off
USD
$2499 $2249
$3999 $3599
$4999 $4249
$5999 $5099


*While we strive to always give you current and accurate information, the numbers depicted on the website are indicative and may differ from the actual numbers in the main report. At Expert Market Research, we aim to bring you the latest insights and trends in the market. Using our analyses and forecasts, stakeholders can understand the market dynamics, navigate challenges, and capitalize on opportunities to make data-driven strategic decisions.*
Get in touch with us for a customized solution tailored to your unique requirements and save upto 35%!
In 2025, the market attained a value of nearly USD 1.75 Billion.
The market is assessed to grow at a CAGR of 6.30% between 2026 and 2035.
The market is estimated to reach around USD 3.22 Billion by 2035.
The market is being driven by the rising health consciousness among the Brazilian population and the increasing influence of social media fitness trends.
The key trends aiding the market expansion include the integration of technology into the running gear and the growth of the e-commerce sector.
The major distribution channels in the market are online and offline.
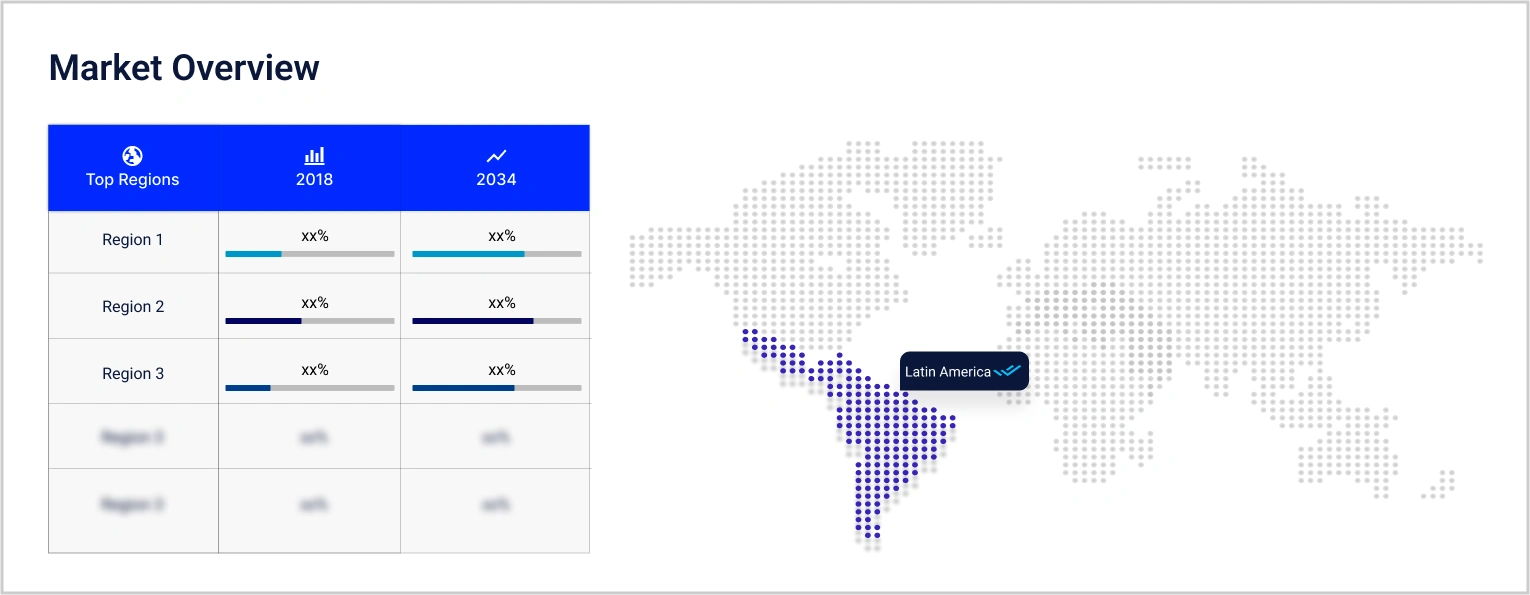
The major regions considered in the market are São Paulo, Minas Gerais, Rio de Janeiro, Bahia, and Rio Grande do Sul, among others.
The major players in the market are Adidas AG, Puma SE, Nike, Inc., Under Armour®, Inc., Asics Corp., Skechers USA, Inc., Actvitta, Columbia Sportswear Company, On Holding AG, and NewBalance, Inc., and others.
Explore our key highlights of the report and gain a concise overview of key findings, trends, and actionable insights that will empower your strategic decisions.
| REPORT FEATURES | DETAILS |
| Base Year | 2025 |
| Historical Period | 2019-2025 |
| Forecast Period | 2026-2035 |
| Scope of the Report |
Historical and Forecast Trends, Industry Drivers and Constraints, Historical and Forecast Market Analysis by Segment
|
| Breakup by Product |
|
| Breakup by Gender |
|
| Breakup by Distribution Channel |
|
| Breakup by Region |
|
| Market Dynamics |
|
| Competitive Landscape |
|
| Companies Covered |
|
Datasheet
One User
USD 2,499
USD 2,249
tax inclusive*
Single User License
One User
USD 3,999
USD 3,599
tax inclusive*
Five User License
Five User
USD 4,999
USD 4,249
tax inclusive*
Corporate License
Unlimited Users
USD 5,999
USD 5,099
tax inclusive*
*Please note that the prices mentioned below are starting prices for each bundle type. Kindly contact our team for further details.*
Flash Bundle
Small Business Bundle
Growth Bundle
Enterprise Bundle
*Please note that the prices mentioned below are starting prices for each bundle type. Kindly contact our team for further details.*
Flash Bundle
Number of Reports: 3
20%
tax inclusive*
Small Business Bundle
Number of Reports: 5
25%
tax inclusive*
Growth Bundle
Number of Reports: 8
30%
tax inclusive*
Enterprise Bundle
Number of Reports: 10
35%
tax inclusive*
How To Order

Select License Type
Choose the right license for your needs and access rights.

Click on ‘Buy Now’
Add the report to your cart with one click and proceed to register.

Select Mode of Payment
Choose a payment option for a secure checkout. You will be redirected accordingly.
Gain insights to stay ahead and seize opportunities.

Get insights & trends for a competitive edge.

Track prices with detailed trend reports.

Analyse trade data for supply chain insights.

Leverage cost reports for smart savings

Enhance supply chain with partnerships.

Connect For More Information
Our expert team of analysts will offer full support and resolve any queries regarding the report, before and after the purchase.
Our expert team of analysts will offer full support and resolve any queries regarding the report, before and after the purchase.
We employ meticulous research methods, blending advanced analytics and expert insights to deliver accurate, actionable industry intelligence, staying ahead of competitors.
Our skilled analysts offer unparalleled competitive advantage with detailed insights on current and emerging markets, ensuring your strategic edge.
We offer an in-depth yet simplified presentation of industry insights and analysis to meet your specific requirements effectively.


Share