

Consumer Insights
Uncover trends and behaviors shaping consumer choices today
Procurement Insights
Optimize your sourcing strategy with key market data
Industry Stats
Stay ahead with the latest trends and market analysis.

Brazil procurement software market size reached around USD 298.39 Million in 2025. The market is projected to grow at a CAGR of 9.60% between 2026 and 2035 to reach nearly USD 746.26 Million by 2035.
Base Year
Historical Period
Forecast Period
Global research conducted by Gartner indicates that by the year 2027, 50% of companies will adopt cloud computing.
In 2022, Brazil's manufacturing output hit USD 213.56 billion, a 26.63% increase from 2021, leading to greater adoption of procurement software to optimise manufacturing processes, consequently expanding the Brazil procurement software market size.
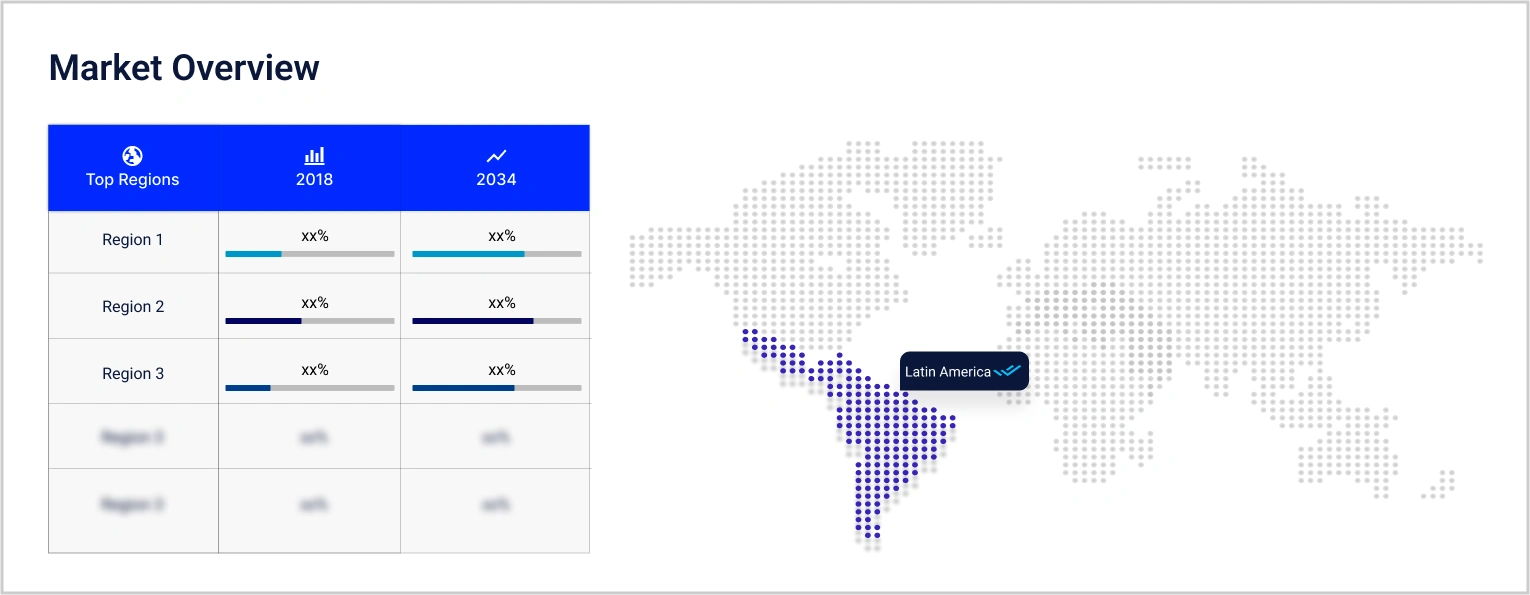
As per industry reports, Brazil holds the position of the largest healthcare market in Latin America, allocating 9.47% of its GDP to healthcare expenditures, amounting to approximately USD 161 billion.
Compound Annual Growth Rate
9.6%
Value in USD Million
2026-2035
*this image is indicative*
| Brazil Procurement Software Market Report Summary | Description | Value |
| Base Year | USD Million | 2025 |
| Historical Period | USD Million | 2019-2025 |
| Forecast Period | USD Million | 2026-2035 |
| Market Size 2025 | USD Million | 298.39 |
| Market Size 2035 | USD Million | 746.26 |
| CAGR 2019-2025 | Percentage | XX% |
| CAGR 2026-2035 | Percentage | 9.60% |
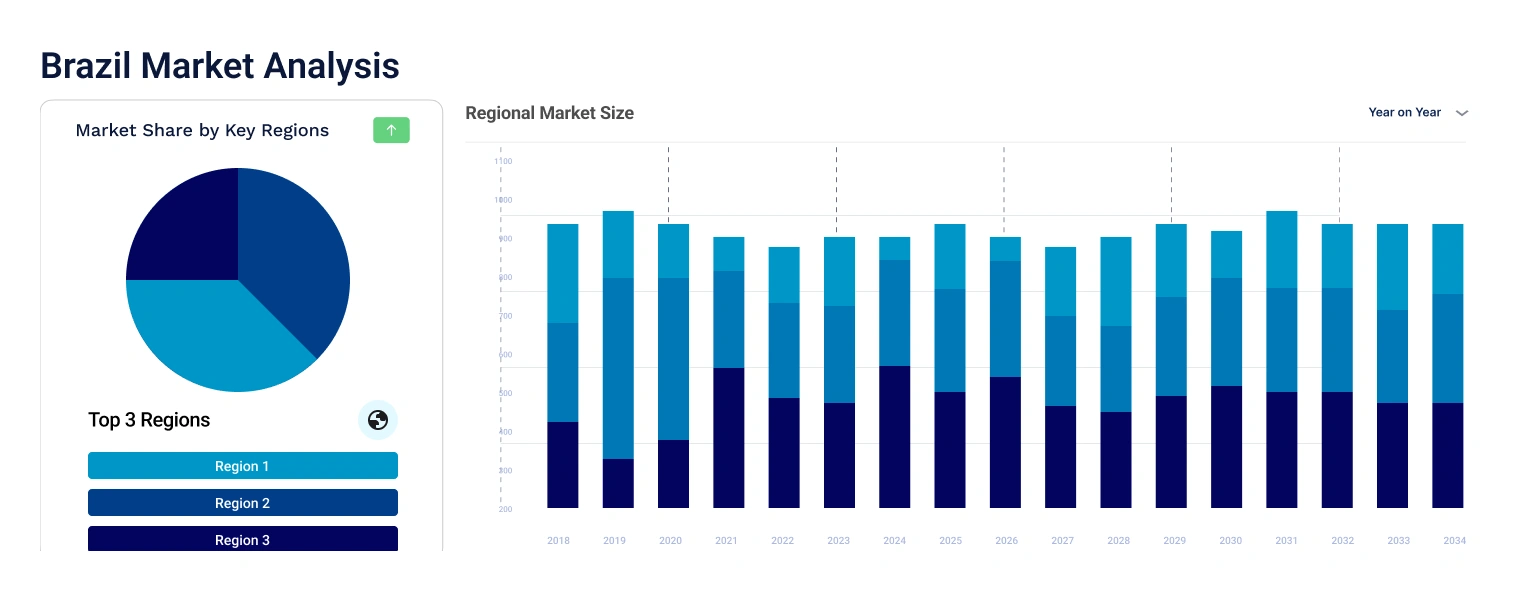
| CAGR 2026-2035 - Market by Region | Minas Gerais | 10.3% |
| CAGR 2026-2035 - Market by Region | Rio Grande do Sul | 9.8% |
| CAGR 2026-2035 - Market by Deployment | Cloud | 10.2% |
| CAGR 2026-2035 - Market by End Use | Healthcare | 10.7% |
| 2025 Market Share by Region | Rio Grande do Sul | 6.8% |
Over the decade leading up to 2022, Brazil's economy witnesses an average retail sales growth of 0.6%. In 2022, the growth rate for retail sales increased to 1.0%, showcasing a robust retail sector in the region. Retailers leverage procurement software to optimise inventory management by automating the reordering process, tracking stock levels, and predicting demand through sales analytics, leading to the Brazil procurement software market development.
This software enables retailers to manage costs more effectively by providing tools for negotiating better terms with suppliers, automating purchase orders, and ensuring compliance with budget limits. Automating routine procurement tasks like processing purchase orders and invoices, reduces manual labour, speeds up the procurement cycle, and minimises the risk of errors.
A market research study commissioned by IBM has shown that the global adoption of Artificial Intelligence (AI) has been on a consistent rise, with 41% of businesses in Brazil reporting that they have actively integrated this AI into their operations, consequently driving up the Brazil procurement software market share. The growing trend of automation is notably enhancing the demand for software acquisition across multiple sectors. By minimising the need for manual involvement in procurement activities, automation facilitates quicker and more efficient operations. Companies are progressively acquiring software solutions to streamline tasks such as order processing, invoice reconciliation, and supplier interactions, thereby reducing human errors and accelerating workflow efficiency.
Increasing adoption of cloud-based procurement software, integration of artificial intelligence into the market, rising focus on sustainable procurement, and the development of mobile procurement software is aiding to the Brazil procurement software market expansion.
There is a rising integration of artificial intelligence and machine learning in procurement software to enable the analysis of vast datasets, predict market trends, identify patterns, and optimise supplier selection. Such software can also automate routine tasks like contract management, invoice processing, and spend analysis.
With the rising trend of sustainability, key players are offering procurement software that provides tools to enable organisations to evaluate their social, ethical, environmental, and economic impacts, leading to the Brazil procurement software market growth.
Blockchain is increasingly integrated into procurement software to improve efficiency, enhance transparency, and automate and streamline processes like invoicing, contract management, and payments.
Key players are developing procurement software that is compatible with mobile phones and offers users the flexibility to manage the procurement process on the go, hence enhancing their productivity.
With unprecedented speed, the companies of Brazil are embracing digitization so that they can promote efficiency, paperless as well as streamline procurement processes. Industry 4.0 and automation trends push companies to spend more on procurement software.
One of the notable Brazil procurement software market trends is the adoption of cloud-based procurement software. Organisations are increasingly adopting cloud-based procurement software to streamline the procurement process, eliminate inefficiencies, reduce operational expenses, eliminate manual intervention and data redundancy, and improve process efficiency.
There is a rising adoption of cloud-based procurement software among organisations as it is cost-effective, scalable, and easy to use. It also streamlines processes, enables real-time collaboration and communication between procurement teams, stakeholders, clients, and suppliers, and increases spending visibility and transparency.
As per the Brazil procurement software market analysis, rapid advancements in technologies such as artificial intelligence, machine learning, and data analytics are aimed at automating repetitive tasks like invoice processing, purchase order creation, and payment reconciliation.
The EMR’s report titled “Brazil Procurement Software Market Report and Forecast 2026-2035” offers a detailed analysis of the market based on the following segments:
Market Breakup by Deployment
Market Breakup by End Use
Market Breakup by Region
| CAGR 2026-2035 - Market by | Region |
| Minas Gerais | 10.3% |
| Rio Grande do Sul | 9.8% |
| Bahia | 9.3% |
| São Paulo | XX% |
| Rio de Janeiro | XX% |
| Others | XX% |
Based on the end use, the market is segmented into retail, manufacturing, transportation and logistics, healthcare, and food and beverages, among others. The healthcare segment is projected to grow at a CAGR of 10.7% during the forecast period of 2026-2035. Procurement software is essential in the healthcare sector as it facilitates the efficient acquisition of goods and services, guarantees adherence to regulations, and enhances cost management.
Major players are focusing on the adoption of automation technologies to gain a competitive edge in the Brazil procurement software market share.
Nimbi S/A was established in 2013 and is headquartered in São Paulo, Brazil. With the use of cloud-based technologies, it offers supply chain management and procurement solutions that assist companies in streamlining procedures and increasing operational effectiveness.
With its base of operations in Munich, Germany, Makersite was established in 2018 and provides manufacturers with lifecycle management and digital twin technologies, allowing them to maximise product sustainability, prices, and compliance.
Jaggaer, which was founded in 1995 and has its headquarters in North Carolina, United States, offers procurement software solutions to worldwide businesses to various sectors for spend control, supplier collaboration, and supply chain optimisation, thereby leading to the the Brazil procurement software market expansion.
SAP SE was established in Weinheim, Germany, in 1972. Its current headquarters are in Walldorf, Germany. It provides on-premises and cloud-based enterprise software for managing business operations, catering to a variety of sectors.
*Please note that this is only a partial list; the complete list of key players is available in the full report. Additionally, the list of key players can be customized to better suit your needs.*
Other key players in the Brazil procurement software market are Coupa Software Inc., among others.


Upto 15% Off
USD
$3999 $3599
$2499 $2249
$4999 $4249
$5999 $5099


*While we strive to always give you current and accurate information, the numbers depicted on the website are indicative and may differ from the actual numbers in the main report. At Expert Market Research, we aim to bring you the latest insights and trends in the market. Using our analyses and forecasts, stakeholders can understand the market dynamics, navigate challenges, and capitalize on opportunities to make data-driven strategic decisions.*
Get in touch with us for a customized solution tailored to your unique requirements and save upto 35%!
In 2025, the market attained a value of nearly USD 298.39 Million.
The market is assessed to grow at a CAGR of 9.60% between 2026 and 2035.
The market is estimated to witness a healthy growth in the forecast period of 2026-2035 to reach about USD 746.26 Million by 2035.
The market is being driven by the rising adoption of automation in various sectors and the growth of the retail sector in the region.
Key trends aiding the market expansion include the shift towards cloud-based procurement software and the robust manufacturing sector in the region.
The major deployments of the market are on-premises and cloud.
Regions considered in the market are São Paulo, Minas Gerais, Rio de Janeiro, Bahia, and Rio Grande do Sul, among others.
Major players in the market are Nimbi S/A, Makersite, Jaggaer, SAP SE, and Coupa Software Inc., among others.
Explore our key highlights of the report and gain a concise overview of key findings, trends, and actionable insights that will empower your strategic decisions.
| REPORT FEATURES | DETAILS |
| Base Year | 2025 |
| Historical Period | 2019-2025 |
| Forecast Period | 2026-2035 |
| Scope of the Report |
Historical and Forecast Trends, Industry Drivers and Constraints, Historical and Forecast Market Analysis by Segment:
|
| Breakup by Deployment |
|
| Breakup by End Use |
|
| Breakup by Region |
|
| Market Dynamics |
|
| Competitive Landscape |
|
| Companies Covered |
|
Single User License
One User
USD 3,999
USD 3,599
tax inclusive*
Datasheet
One User
USD 2,499
USD 2,249
tax inclusive*
Five User License
Five User
USD 4,999
USD 4,249
tax inclusive*
Corporate License
Unlimited Users
USD 5,999
USD 5,099
tax inclusive*
*Please note that the prices mentioned below are starting prices for each bundle type. Kindly contact our team for further details.*
Flash Bundle
Small Business Bundle
Growth Bundle
Enterprise Bundle
*Please note that the prices mentioned below are starting prices for each bundle type. Kindly contact our team for further details.*
Flash Bundle
Number of Reports: 3
20%
tax inclusive*
Small Business Bundle
Number of Reports: 5
25%
tax inclusive*
Growth Bundle
Number of Reports: 8
30%
tax inclusive*
Enterprise Bundle
Number of Reports: 10
35%
tax inclusive*
How To Order

Select License Type
Choose the right license for your needs and access rights.

Click on ‘Buy Now’
Add the report to your cart with one click and proceed to register.

Select Mode of Payment
Choose a payment option for a secure checkout. You will be redirected accordingly.
Gain insights to stay ahead and seize opportunities.

Get insights & trends for a competitive edge.

Track prices with detailed trend reports.

Analyse trade data for supply chain insights.

Leverage cost reports for smart savings

Enhance supply chain with partnerships.

Connect For More Information
Our expert team of analysts will offer full support and resolve any queries regarding the report, before and after the purchase.
Our expert team of analysts will offer full support and resolve any queries regarding the report, before and after the purchase.
We employ meticulous research methods, blending advanced analytics and expert insights to deliver accurate, actionable industry intelligence, staying ahead of competitors.
Our skilled analysts offer unparalleled competitive advantage with detailed insights on current and emerging markets, ensuring your strategic edge.
We offer an in-depth yet simplified presentation of industry insights and analysis to meet your specific requirements effectively.


Share