

Consumer Insights
Uncover trends and behaviors shaping consumer choices today
Procurement Insights
Optimize your sourcing strategy with key market data
Industry Stats
Stay ahead with the latest trends and market analysis.

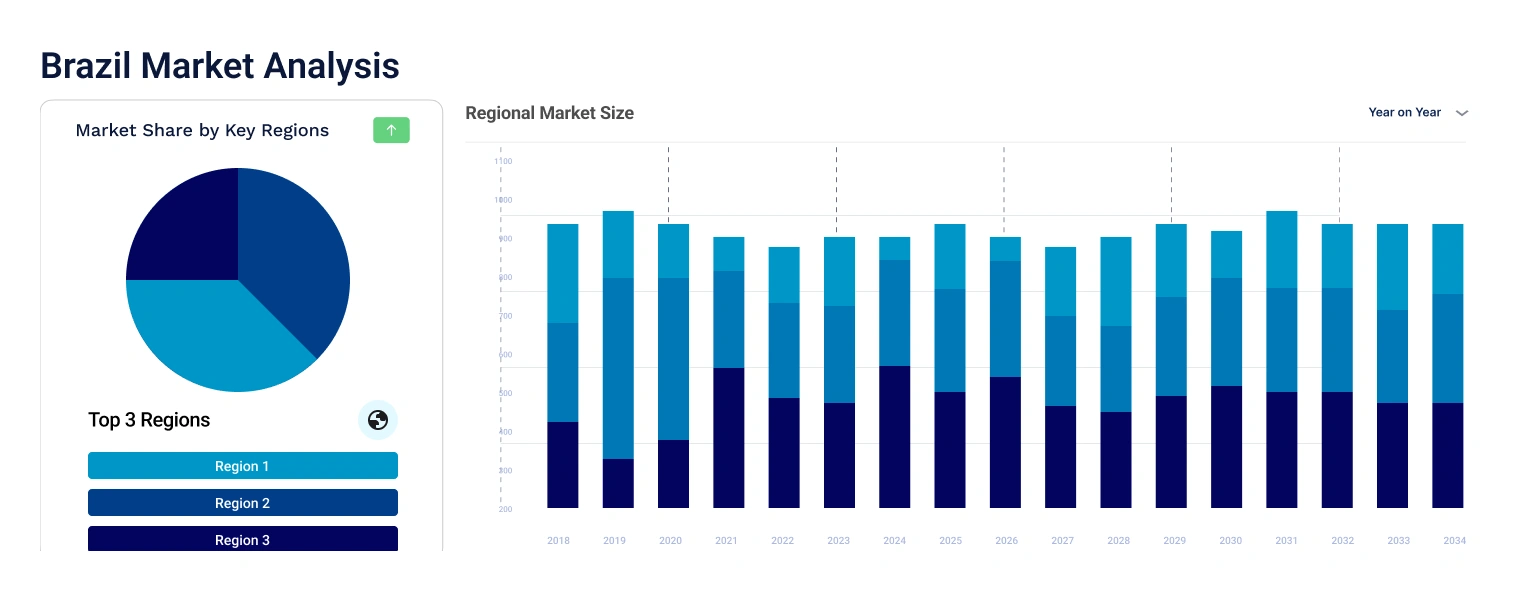
The Brazil intellectual property software market is projected to grow at a CAGR of 16.70% between 2026 and 2035. The market is being driven by the increasing number of patent and trademark applications in the country.
Base Year
Historical Period
Forecast Period
In 2022, Brazil received 6,984 patent applications from foreigners and domestic residents.
Over 23% of trademarks received in Brazil in 2022 belonged to the class of business management and advertising.
Over 10% of all new industrial designs belonged to the class of building and construction.
Compound Annual Growth Rate
16.7%
2026-2035
*this image is indicative*
| Brazil Intellectual Property Software Market Report Summary | Description | Value |
| Base Year | USD Million | 2025 |
| Historical Period | USD Million | 2019-2025 |
| Forecast Period | USD Million | 2026-2035 |
| Market Size 2025 | USD Million | XX |
| Market Size 2035 | USD Million | XX |
| CAGR 2019-2025 | Percentage | XX% |
| CAGR 2026-2035 | Percentage | 16.70% |
| CAGR 2026-2035 - Market by Region | São Paulo | 19.9% |
| CAGR 2026-2035 - Market by End Use | BFSI | 18.9% |
| CAGR 2026-2035 - Market by Type | Patent Intellectual Property Management | 19.0% |
| Market Share by Region 2025 | Rio de Janeiro | XX% |
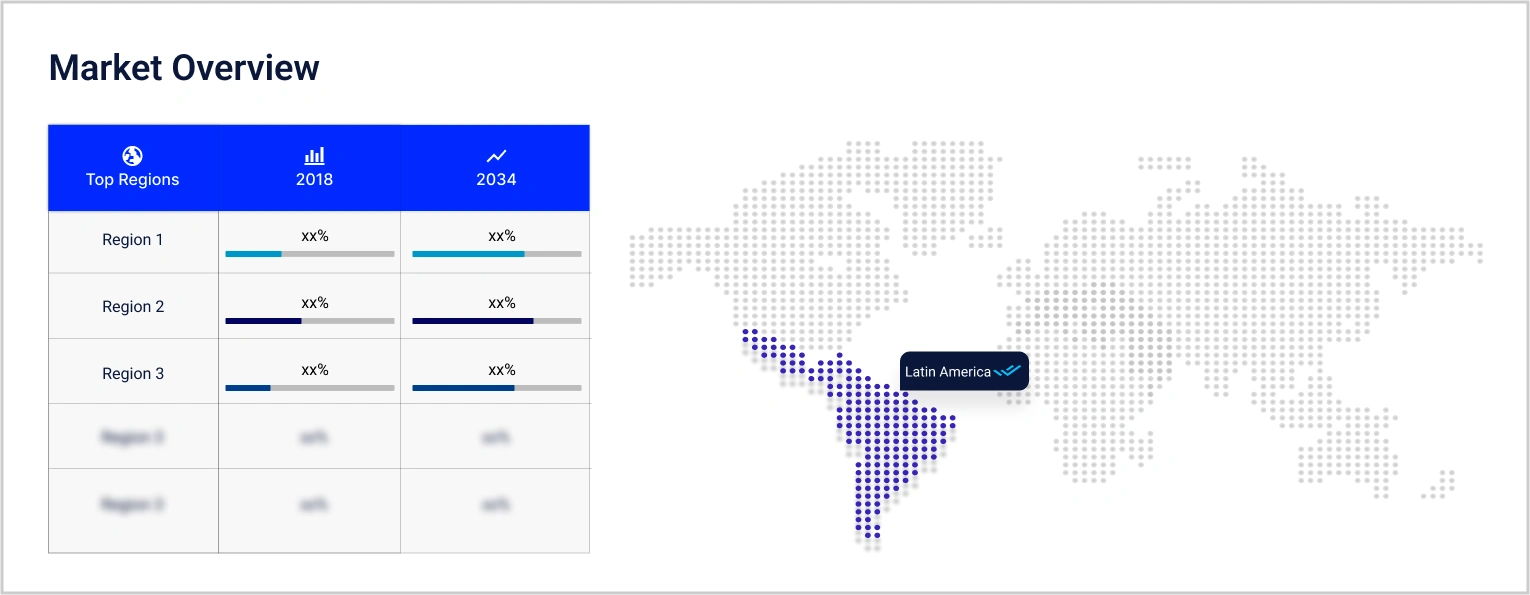
Brazil is among the leading recipient of patent and trademark applications in Latin America and the Caribbean region. Over 8% of patents are related to medical technology, and others are related to pharmaceuticals, civil engineering, and basic materials chemistry, among others. Education, clothing and apparel, and scientific services are among the leading sectors that are witnessing an emergence of new trademarks. This is expected to lead to an increase in the demand for intellectual property software, which can assist organisations in organising and managing their intellectual property assets and ensuring that their innovations do not infringe on any existing IP.
In 2022, Brazil received 8,097 industrial design applications, which originated across different categories such as furnishing (over 12%), games, sporting goods, and toys (over 9%), machines (over 9%), and travel goods (over 6%), among others. The top foreign destinations for such applications were the EU (over 33%), followed by the United States (over 18%), China (over 10%), the United Kingdom (over 8%) and others (over 24%). This is expected to necessitate the requirement of intellectual property software, which ensures the compliance of all intellectual property assets with regulatory laws and helps in analysing the value and performance of IP portfolios.
Brazil Intellectual Property Software Market Report and Forecast 2026-2035 offers a detailed analysis of the market based on the following segments:
Market Breakup by Component
Market Breakup by Type
Market Breakup by Deployment Type
Market Breakup by End Use
Market Breakup by Region
| CAGR 2026-2035 - Market by | Type |
| Patent Intellectual Property Management | 19.0% |
| Trademark Intellectual Property Management | 17.9% |
| Copyright Intellectual Property Management | XX% |
| Design Intellectual Property Management | XX% |
| Others | XX% |
| CAGR 2026-2035 - Market by | End Use |
| BFSI | 18.9% |
| Automotive | 17.9% |
| IT and Telecom | XX% |
| Healthcare | XX% |
| Others | XX% |
| CAGR 2026-2035 - Market by | Region |
| São Paulo | 19.9% |
| Minas Gerais | 18.4% |
| Rio de Janeiro | XX% |
| Bahia | XX% |
| Rio Grande do Sul | XX% |
Based on type, the market is divided into patent intellectual property management, trademark intellectual property management, copyright intellectual property management, and design intellectual property management, among others. Over the forecast period, trademark intellectual property management software is estimated to grow at a CAGR of 17.9% between 2026 and 2035, as innovations in branding and advertising of new businesses surge.
Major manufacturers are expected to develop advanced intellectual property software tools that cater to the requirements of different end-use industries, including automotive, healthcare, BFSI, and IT and telecom, among others.


Upto 15% Off
USD
$2499 $2249
$3999 $3599
$4999 $4249
$5999 $5099


*While we strive to always give you current and accurate information, the numbers depicted on the website are indicative and may differ from the actual numbers in the main report. At Expert Market Research, we aim to bring you the latest insights and trends in the market. Using our analyses and forecasts, stakeholders can understand the market dynamics, navigate challenges, and capitalize on opportunities to make data-driven strategic decisions.*
Get in touch with us for a customized solution tailored to your unique requirements and save upto 35%!
The market is projected to grow at a CAGR of 16.70% between 2026 and 2035.
The different types of intellectual property software in the market include software and services.
The different types of intellectual property software in Brazil include patent intellectual property management, trademark intellectual property management, copyright intellectual property management, and design intellectual property management, among others.
The different end uses of intellectual property software include BFSI, automotive, IT and telecom, and healthcare, among others.
The different regions covered in the market report are São Paulo, Minas Gerais, Rio de Janeiro, Bahia, and Rio Grande do Sul.
The key market players are LCD CONSULTORIA LTDA., Clarivate PLC, Gaiarsa & Meyer Intellectual Property Ltd., Ilupi, VILAGE Marcas e Patentes Ltda, and Costa Rodrigues and Röse Advocacia, among others.
Explore our key highlights of the report and gain a concise overview of key findings, trends, and actionable insights that will empower your strategic decisions.
| REPORT FEATURES | DETAILS |
| Base Year | 2025 |
| Historical Period | 2019-2025 |
| Forecast Period | 2026-2035 |
| Scope of the Report |
Historical and Forecast Trends, Industry Drivers and Constraints, Historical and Forecast Market Analysis by Segment:
|
| Breakup by Component |
|
| Breakup by Type |
|
| Breakup by Deployment Type |
|
| Breakup by End Use |
|
| Breakup by Region |
|
| Market Dynamics |
|
| Competitive Landscape |
|
| Companies Covered |
|
Datasheet
One User
USD 2,499
USD 2,249
tax inclusive*
Single User License
One User
USD 3,999
USD 3,599
tax inclusive*
Five User License
Five User
USD 4,999
USD 4,249
tax inclusive*
Corporate License
Unlimited Users
USD 5,999
USD 5,099
tax inclusive*
*Please note that the prices mentioned below are starting prices for each bundle type. Kindly contact our team for further details.*
Flash Bundle
Small Business Bundle
Growth Bundle
Enterprise Bundle
*Please note that the prices mentioned below are starting prices for each bundle type. Kindly contact our team for further details.*
Flash Bundle
Number of Reports: 3
20%
tax inclusive*
Small Business Bundle
Number of Reports: 5
25%
tax inclusive*
Growth Bundle
Number of Reports: 8
30%
tax inclusive*
Enterprise Bundle
Number of Reports: 10
35%
tax inclusive*
How To Order

Select License Type
Choose the right license for your needs and access rights.

Click on ‘Buy Now’
Add the report to your cart with one click and proceed to register.

Select Mode of Payment
Choose a payment option for a secure checkout. You will be redirected accordingly.
Gain insights to stay ahead and seize opportunities.

Get insights & trends for a competitive edge.

Track prices with detailed trend reports.

Analyse trade data for supply chain insights.

Leverage cost reports for smart savings

Enhance supply chain with partnerships.

Connect For More Information
Our expert team of analysts will offer full support and resolve any queries regarding the report, before and after the purchase.
Our expert team of analysts will offer full support and resolve any queries regarding the report, before and after the purchase.
We employ meticulous research methods, blending advanced analytics and expert insights to deliver accurate, actionable industry intelligence, staying ahead of competitors.
Our skilled analysts offer unparalleled competitive advantage with detailed insights on current and emerging markets, ensuring your strategic edge.
We offer an in-depth yet simplified presentation of industry insights and analysis to meet your specific requirements effectively.


Share