

Consumer Insights
Uncover trends and behaviors shaping consumer choices today
Procurement Insights
Optimize your sourcing strategy with key market data
Industry Stats
Stay ahead with the latest trends and market analysis.

The biochar market attained a value of USD 809.41 Million in 2025. The industry is expected to grow at a CAGR of 15.30% during the forecast period of 2026-2035. By 2035, the market is expected to reach USD 3360.95 Million.
The rising assistance in reducing greenhouse gas emissions is one of the key biochar market trends due to its ability to lower atmospheric CO₂ levels and support climate change mitigation goals. Governments and corporations increasingly invest in biochar projects to meet carbon neutrality targets and participate in carbon credit markets. In February 2025, the University of Valladolid collaborated with the Brañosera Town Hall and the Santa María la Real Foundation to launch the Reactiva Brañosera project in Spain to improve soil properties and enhance carbon sequestration. This makes biochar a powerful tool in climate strategies worldwide, driving demand in sectors focused on environmental responsibility and carbon offsetting.
Integration of biochar production with renewable energy sources is increasing sustainability and reducing operational costs. Coupling biochar technology with bioenergy plants maximizes biomass utilization, improving economic and environmental outcomes. In January 2023, Clean Energy Technologies partnered with Synergy Bioproducts to build a commercial-scale plant in Vermont to simultaneously generate renewable electricity and produce 1,500 t of biochar annually from forestry biomass. This synergy is encouraging adoption in regions prioritizing clean energy and sustainable development.
Product diversification is favoring the biochar market revenue by expanding applications in agriculture, livestock, water treatment, and construction. Companies are developing tailored biochar products to serve as soil blends, animal feed additives, and carbon-negative building materials. In June 2205, ICL introduced BIOZ® Jet, a liquid biochar extract using EVOIA’s FYR® technology to enhance early crop growth and resilience. This versatility attracts varied industries and supports broader adoption of sustainable carbon solutions globally.
Base Year
Historical Period
Forecast Period
It is estimated that biochar can lower carbon dioxide emissions by 1.36-3.00 gigatons by 2050.
The lifetime net operational savings by the implementation of biochar is estimated to be between USD 333.20 billion and USD 663.11 billion.
The incorporation of biochar in infertile soil can reduce the loss of nutrients through the process of leaching.
Compound Annual Growth Rate
15.3%
Value in USD Million
2026-2035
*this image is indicative*
| Global Biochar Market Report Summary | Description | Value |
| Base Year | USD Million | 2025 |
| Historical Period | USD Million | 2019-2025 |
| Forecast Period | USD Million | 2026-2035 |
| Market Size 2025 | USD Million | 809.41 |
| Market Size 2035 | USD Million | 3360.95 |
| CAGR 2019-2025 | Percentage | XX% |
| CAGR 2026-2035 | Percentage | 15.30% |
| CAGR 2026-2035 - Market by Region | Asia Pacific | 17.7% |
| CAGR 2026-2035 - Market by Country | India | 17.9% |
| CAGR 2026-2035 - Market by Country | China | 16.9% |
| CAGR 2026-2035 - Market by Technology | Pyrolysis | 17.2% |
| CAGR 2026-2035 - Market by Application | Agriculture | 17.8% |
| Market Share by Country 2025 | Germany | 4.5% |
Rising importance in sustainable agriculture to enhance soil fertility, moisture retention, and nutrient availability is shaping the biochar market forecast. Farmers increasingly adopt biochar to boost crop yields organically, reduce chemical fertilizer use, and improve soil health. In June 2025, ADRA Cambodia launched the V BIOCHAR initiative that integrated biochar with vermicompost to boost climate-smart agriculture across 71 villages. This trend is propelled by rising awareness of environmental impacts linked to conventional farming and growing demand for organic food products globally.
Biochar production offers an innovative solution for managing agricultural residues, forestry waste, and organic byproducts. Converting waste biomass into valuable biochar reduces landfill use and methane emissions. In January 2025, Green Carbon and Thailand’s RAOT launched a major project to convert rubber tree waste into large-scale carbon credits using biochar. Such instances support circular economy principles by transforming waste into resource, reducing environmental footprint, and promoting resource efficiency. Industries are also increasingly adopting biochar technologies to meet regulatory requirements and sustainability commitments related to waste reduction.
Supportive government regulations, subsidies, and grants are driving the biochar industry value, in terms of production and usage. Many countries are integrating biochar into national climate action plans, agricultural improvement programs, and waste management policies. In August 2024, the Japanese government selected several climate and environment projects in Southeast Asia for government funding, including initiatives promoting biochar development. These projects aim to support sustainable agriculture and carbon reduction efforts in the region. Government backing also accelerates market growth by fostering innovation, infrastructure development, and widespread implementation.
As industries and governments intensify efforts to reduce environmental impacts, sourcing biomass feedstock sustainably has become essential. Biochar production utilizes agricultural residues, forestry waste, or invasive plants that would otherwise go unused or contribute to emissions through open burning. In November 2024, Cameroon introduced a biochar project for converting banana peels into eco-charcoal as a sustainable alternative to traditional wood charcoal. This sustainable sourcing aligns with circular economy goals, reducing raw material waste and promoting low-carbon practices.
Ongoing research and development advances for understanding mechanisms, optimal production methods, and application benefits are complimenting the biochar demand forecast. Universities, research institutions, and private companies are collaborating on biochar innovations, testing new feedstocks and applications. In November 2024, IIT Dhanbad partnered with Sentra.world to research biochar's application in steelmaking to reduce emissions and utilize surplus biomass. These efforts enhance product quality, reduce costs, and open new market segments, sustaining long-term growth in the biochar industry.
Read more about this report - REQUEST FREE SAMPLE COPY IN PDF
The EMR’s report titled “Biochar Market Report and Forecast 2026-2035” offers a detailed analysis of the market based on the following segments:
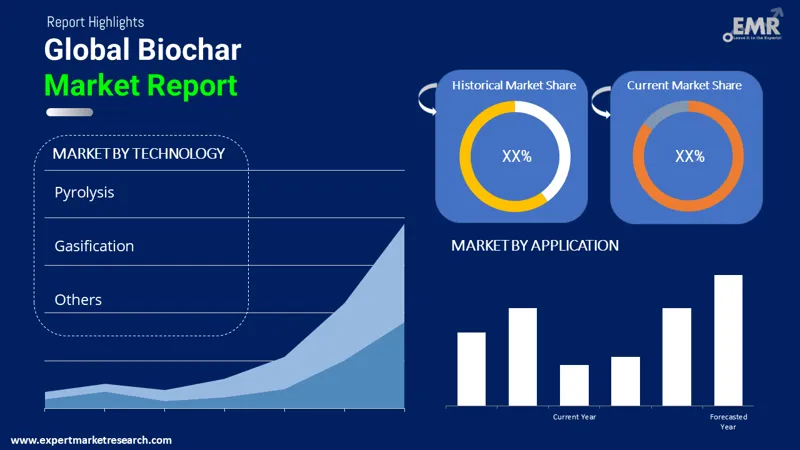
Market Breakup by Technology
Key Insight: Pyrolysis is a dominant technology in the biochar market, due to its high efficiency and versatility. This process yields biochar, syngas, and bio-oil, making it economically attractive. Slow pyrolysis is largely preferred for maximizing biochar yield, especially in agricultural applications where soil enhancement is the focus. Driven by these benefits, companies are using proprietary pyrolysis methods to create high-quality, carbon-rich biochar for use in agriculture, carbon credits, and industrial applications. For instance, in August 2023, ONNU revealed plans to build the first of 16 United Kingdom pyrolysis hubs in Wye Valley for turning biomass into biochar to support the net zero transition.
Market Breakup by Application
Key Insight: In agriculture, the biochar market value is growing with wide usage in livestock, general, and organic farming due to its soil-enhancing and carbon-sequestering properties. In livestock farming, biochar is added to animal feed and bedding to improve digestion, reduce methane emissions, and control odour. In general farming, biochar improves soil structure, boosts nutrient retention, and enhances crop yields. In organic farming, biochar aligns with sustainable practices, enriching compost and reducing the need for synthetic inputs. For instance, in September 2024, Samunnati’s Carbon Incubator “Biochar” was unveiled to support Farmer Producer Organizations by converting farm residues into carbon-rich soil enhancers and integrating farmers into carbon credit markets.
Market Breakup by Region
Key Insight: The biochar market share in North America is driven by extensive agricultural use, environmental policies, and strong research initiatives. The United States leads with projects integrating biochar for soil improvement, waste management, and carbon credits. In October 2024, Sitos Group partnered with Treehouse California Almonds to establish a USD 9 million biochar facility in Delano, California. Additionally, government incentives support biochar in carbon sequestration programs. The market is also boosted by technological advancements in pyrolysis and gasification, making North America a hub for innovation and commercialization.
Read more about this report - REQUEST FREE SAMPLE COPY IN PDF
Gasification to Boost Biochar Production
Gasification holds a major biochar market share due to its benefit of energy generation and carbon-rich byproduct production. In this process, biomass is partially combusted at high temperatures with limited oxygen, producing syngas for energy and biochar as a byproduct, driving innovations. In June 2024, Finland’s VTT Technical Research Centre unveiled a flexible fluidized-bed gasification process to efficiently produce high-grade syngas and biochar, scalable via rigs for aligning with advanced renewable energy goals. Moreover, gasification systems are favored in regions aiming to integrate renewable energy with carbon sequestration.
Surging Biochar Applications in Households
The household segment of the biochar market is steadily growing, particularly in developing regions where clean cooking and waste management are priorities. Biochar-producing cookstoves allow households to generate their own biochar while cooking with biomass. This reduces indoor air pollution and fuel costs. Additionally, in rural India and parts of sub-Saharan Africa, small-scale farmers use household kilns to convert agricultural waste into biochar for improving food security. For instance, in October 2024, atmosfair received the world’s first carbon removal credits for biochar produced from efficient wood gasification stoves, integrating biochar production into household cooking solutions.


Europe & Asia Pacific to Drive Biochar Industry Expansion
Europe holds a significant value in the biochar market, focusing on sustainability and circular economy goals. Germany and the United Kingdom are investing in biochar projects to reduce agricultural emissions and improve soil health. The stringent environmental regulations of European Union and carbon trading schemes are further encouraging biochar adoption, especially in organic and general farming sectors, contributing to decarbonization and enhanced soil productivity.
| CAGR 2026-2035 - Market by | Country |
| India | 17.9% |
| China | 16.9% |
| Canada | 15.1% |
| UK | 14.0% |
| France | 12.0% |
| USA | XX% |
| Germany | XX% |
| Italy | XX% |
| Japan | 10.6% |
| Australia | XX% |
| Saudi Arabia | XX% |
| Brazil | XX% |
| Mexico | XX% |
The Asia Pacific biochar market is rapidly growing, driven by surging awareness of environmental benefits and the dominance of sustainable agriculture. The region witnesses high demand in agriculture, where biochar is used to improve soil quality and boost crop yields. Additionally, biochar is popular in carbon sequestration efforts, as it stores carbon for long periods. In May 2025, the Union Ministry of India encouraged farmers to adopt biochar and mechanization to enhance crop yields and reduce input costs. This strong government support and greater interest in renewable energy are driving the regional market's expansion.
Key players in the biochar market are adopting several strategic approaches to strengthen their market presence and drive growth. With technological innovation, companies are investing in advanced pyrolysis and gasification technologies to enhance biochar yield, quality, and carbon sequestration potential. Strategic partnerships and collaborations are allowing firms to expand geographically and access new feedstock sources or distribution networks. Collaborations between biochar producers and agricultural or energy companies are also helping to integrate biochar into regenerative farming and circular economy models.
Another key strategy is certification and carbon credit validation, with companies aligning with leading carbon registries to ensure transparency and monetize carbon removal efforts. This boosts credibility and attracts climate-conscious investors and buyers. Product diversification is also gaining traction, with firms offering biochar tailored for soil health, water filtration, construction, and animal feed. Additionally, market players are focused on scaling production through modular or decentralized units to meet rising global demand efficiently.
Founded in 2009 and headquartered in Oakdale, the United States, National Carbon Technologies (NCT) operates North America’s largest biocarbon production facility in Marquette, Michigan. With over 100 patents and a proprietary pyrolysis platform, the firm converts hundreds of thousands of tons of biomass into tailored biochar, enhancing soil, energy, metal, and water applications.
Founded in 2008 in Québec, Canada, Airex Energy developed its proprietary CarbonFX torrefaction technology. The firm’s Carbonity plant in Port Cartier, North America’s largest biochar facility, aims for 350,000 t/year by 2035, enabling biocoal, biocarbon, and biochar production from forestry residues.
Phoenix Energy, founded in 1996 and headquartered in the United Kingdom, specializes in modular pyrolysis systems transforming agricultural and forestry residues into high-quality biochar. The company focuses on decentralized, scalable production units and strategic partnerships, enabling local biochar usage for soil enhancement and carbon sequestration in the United States.
Based in Garrel, Germany and founded in 2016, Carbonis GmbH & Co. KG manufactures biochar through sustainable pyrolysis of forestry and agricultural residues while its carbon-negative biochar supports soil health, water treatment, and industrial carbon removal. The firm is recognized for aligning with EU environmental standards and advancing circular economies.
*Please note that this is only a partial list; the complete list of key players is available in the full report. Additionally, the list of key players can be customized to better suit your needs.*
Other players in the biochar market are Biochar Supreme, LLC, and Soil Reef LLC, among others.
Download your free sample report on biochar market trends 2026 to explore detailed quantitative data, key drivers, and emerging opportunities. Stay informed with expert analysis and forecasts to make strategic decisions and capitalize on the growing demand in the biochar industry. Don’t miss out on the latest market insights for successful business planning.


Upto 15% Off
USD
$2499 $2249
$3999 $3599
$4999 $4249
$5999 $5099


*While we strive to always give you current and accurate information, the numbers depicted on the website are indicative and may differ from the actual numbers in the main report. At Expert Market Research, we aim to bring you the latest insights and trends in the market. Using our analyses and forecasts, stakeholders can understand the market dynamics, navigate challenges, and capitalize on opportunities to make data-driven strategic decisions.*
Get in touch with us for a customized solution tailored to your unique requirements and save upto 35%!
In 2025, the market reached an approximate value of USD 809.41 Million.
The market is projected to reach a value of around USD 3360.95 Million by 2035.
The key trends aiding the market include increased adoption of biochar in organic farming, a growing focus on carbon sequestration, potential applications of biochar in waste management, and technological advancements enhancing biochar production.
The key regional markets for biochar are North America, Europe, the Asia Pacific, Latin America, and the Middle East and Africa.
The major technologies for biochar production include pyrolysis and gasification, among others.
Rapid advancements in technologies are leading to the development of more efficient and sustainable ways for biochar production.
The major application segments of biochar are agriculture and household, among others.
The key players in the market report include National Carbon Technologies LLC, Airex Energy Inc., Phoenix Energy, Biochar Supreme, LLC, Carbonis GmbH & Co. KG, and Soil Reef LLC, among others.
The market is projected to grow at a CAGR of 15.30% between 2026 and 2035.
Pyrolysis is a dominant technology in the market, due to its high efficiency and versatility.
Key strategies driving the market include technological innovation in pyrolysis and gasification, strategic partnerships, expanding applications in agriculture and carbon sequestration, government support and subsidies, focus on sustainability, and increasing investments to scale production capacity and improve product quality, boosting market adoption globally.
Explore our key highlights of the report and gain a concise overview of key findings, trends, and actionable insights that will empower your strategic decisions.
| REPORT FEATURES | DETAILS |
| Base Year | 2025 |
| Historical Period | 2019-2025 |
| Forecast Period | 2026-2035 |
| Scope of the Report |
Historical and Forecast Trends, Industry Drivers and Constraints, Historical and Forecast Market Analysis by Segment:
|
| Breakup by Technology |
|
| Breakup by Application |
|
| Breakup by Region |
|
| Market Dynamics |
|
| Competitive Landscape |
|
| Companies Covered |
|
| Report Price and Purchase Option | Explore our purchase options that are best suited to your resources and industry needs. |
| Delivery Format | Delivered as an attached PDF and Excel through email, with an option of receiving an editable PPT, according to the purchase option. |
Datasheet
One User
USD 2,499
USD 2,249
tax inclusive*
Single User License
One User
USD 3,999
USD 3,599
tax inclusive*
Five User License
Five User
USD 4,999
USD 4,249
tax inclusive*
Corporate License
Unlimited Users
USD 5,999
USD 5,099
tax inclusive*
*Please note that the prices mentioned below are starting prices for each bundle type. Kindly contact our team for further details.*
Flash Bundle
Small Business Bundle
Growth Bundle
Enterprise Bundle
*Please note that the prices mentioned below are starting prices for each bundle type. Kindly contact our team for further details.*
Flash Bundle
Number of Reports: 3
20%
tax inclusive*
Small Business Bundle
Number of Reports: 5
25%
tax inclusive*
Growth Bundle
Number of Reports: 8
30%
tax inclusive*
Enterprise Bundle
Number of Reports: 10
35%
tax inclusive*
How To Order

Select License Type
Choose the right license for your needs and access rights.

Click on ‘Buy Now’
Add the report to your cart with one click and proceed to register.

Select Mode of Payment
Choose a payment option for a secure checkout. You will be redirected accordingly.
Gain insights to stay ahead and seize opportunities.

Get insights & trends for a competitive edge.

Track prices with detailed trend reports.

Analyse trade data for supply chain insights.

Leverage cost reports for smart savings

Enhance supply chain with partnerships.

Connect For More Information
Our expert team of analysts will offer full support and resolve any queries regarding the report, before and after the purchase.
Our expert team of analysts will offer full support and resolve any queries regarding the report, before and after the purchase.
We employ meticulous research methods, blending advanced analytics and expert insights to deliver accurate, actionable industry intelligence, staying ahead of competitors.
Our skilled analysts offer unparalleled competitive advantage with detailed insights on current and emerging markets, ensuring your strategic edge.
We offer an in-depth yet simplified presentation of industry insights and analysis to meet your specific requirements effectively.


Share