

Consumer Insights
Uncover trends and behaviors shaping consumer choices today
Procurement Insights
Optimize your sourcing strategy with key market data
Industry Stats
Stay ahead with the latest trends and market analysis.
Trending Now


Base Year
Historical Year
Forecast Year


The global beverage cans market size reached a value of USD 40.46 billion in 2024. During the forecast period of between 2025 and 2034, the market is expected to grow at a CAGR of 5.30% to reach a value of around USD 64.41 billion by 2034.
Read more about this report - REQUEST FREE SAMPLE COPY IN PDF
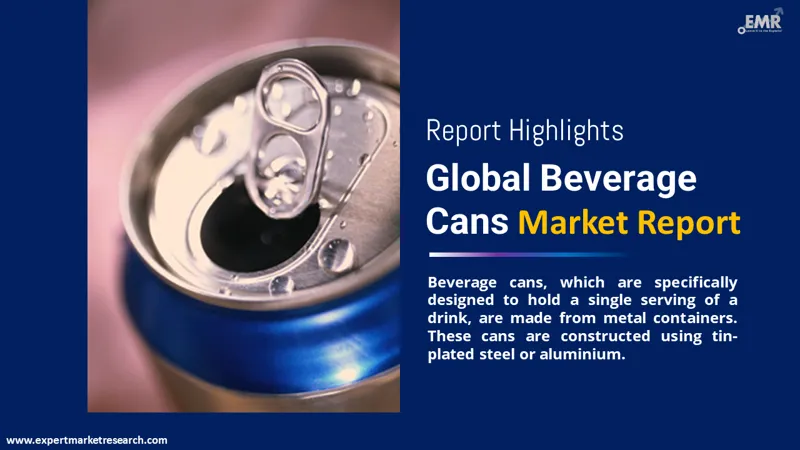
Metal containers called beverage cans are designed to accommodate a fixed single serving of a beverage. These cans are constructed of aluminium or steel that has been tin-plated. Aluminium is frequently used to make beverage cans because it is environmentally friendly and can be recycled easily without losing any of its strength or quality.


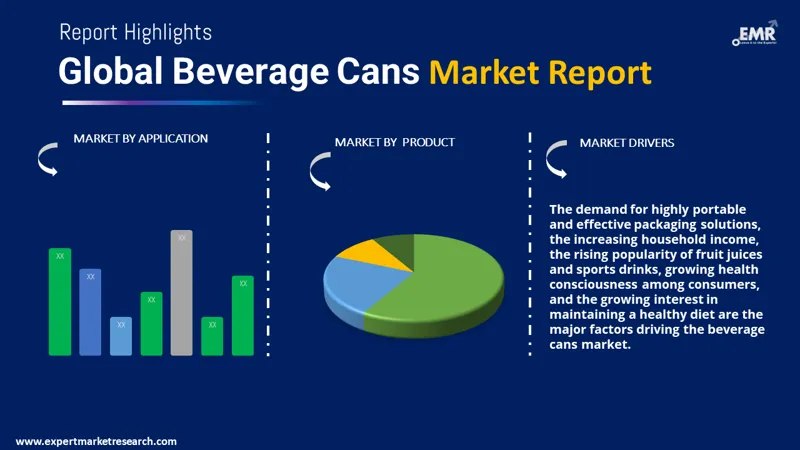
Based on product, the market is divided into steel and aluminium. The market on the basis of application is categorised into alcoholic beverages, carbonated drinks, and fruit and vegetable juices, among others. The regional markets for beverage cans can be classified into North America, Europe, the Asia Pacific, Latin America, and the Middle East and Africa.
The comprehensive EMR report provides an in-depth assessment of the market based on the Porter's five forces model along with giving a SWOT analysis. The report gives a detailed analysis of the following key players in the global beverage cans market, covering their competitive landscape and latest developments like mergers, acquisitions, investments, and expansion plans.
Read more about this report - REQUEST FREE SAMPLE COPY IN PDF
The aluminium segment is currently dominating the beverage cans market as it gives packaged beverages a longer shelf life, and is recyclable. The most recycled beverage containers globally are aluminium cans. The material also preserves the structure and integrity of packaged goods and can easily be sterilised. Lightweight and stackable, they increase shipping and storage efficiency.
Aluminium cans are being used more frequently as a result of rising worldwide beverage consumption as well as a surge in demand for sustainable packaging options. These cans are also aesthetically pleasing because they can be customised with different colours, 3D prints, and embossing.
Steel has a relatively strong heat conductivity, which enables cans to cool down quickly after sterilisation. However, aluminium’s excellent ductility and recyclability, low weight, versatility in printing, and lower potential for toxicity than steel have, nonetheless, attracted manufacturers to the increased use of aluminium material for beverage can production.
North America is anticipated to dominate the global beverage cans market due to the high consumption of beverage cans in countries such as the United States. Consumers' high product uptake, rising per-person carbonated beverage consumption, and regional awareness of sustainability are supporting the growth of the market in the region. Growing health concern of consumers have resulted in a significant demand for wholesome and nutritious beverages in the United States, thus propelling the market growth.
Additionally, restrictions on plastic packaging in nations like the United States and Canada may impede the expansion of plastic packaging in the area, resulting in improved demand for beverage cans. In the Asia Pacific increased disposable income in developing nations like India and China, is increasing the demand for beverages, and correspondingly beverage cans.
Ball Corporation based in Colorado, United States offers cutting-edge, environmentally friendly aluminium packaging options for manufacturers of household beverages and goods, and personal care items. The company also offers aerospace and other technologies and services to government and commercial clients. The business, which was founded in 1880, has more than 21,500 employees globally.
Crown Holdings, Inc., formerly known as Crown Cork & Seal Company, is an American corporation that produces metal cans for food and beverages, metal closures, metal aerosol containers, and speciality packing.
GZI Industries Limited, established in 2006, is a renowned manufacturer and maker of superior quality aluminium beverage cans. The company stays operationally effective, inventive, and sustainable by utilising best-in-class production methods and the most recent high-speed beverage lines, giving customers the greatest possible value and service.
Other market players include CPMC Holdings Limited, Ardagh Group S.A, Nampak Ltd., and Ceylon Beverage Can (Pvt) Ltd, among others.
| REPORT FEATURES | DETAILS |
| Base Year | 2023 |
| Historical Period | 2018-2024 |
| Forecast Period | 2025-2034 |
| Scope of the Report |
Historical and Forecast Trends, Industry Drivers and Constraints, Historical and Forecast Market Analysis by Segment:
|
| Breakup by Product |
|
| Breakup by Application |
|
| Breakup by Region |
|
| Market Dynamics |
|
| Competitive Landscape |
|
| Companies Covered |
|
*While we strive to always give you current and accurate information, the numbers depicted on the website are indicative and may differ from the actual numbers in the main report. At Expert Market Research, we aim to bring you the latest insights and trends in the market. Using our analyses and forecasts, stakeholders can understand the market dynamics, navigate challenges, and capitalize on opportunities to make data-driven strategic decisions.*
Get in touch with us for a customized solution tailored to your unique requirements and save upto 35%!
In 2024, the global market attained a value of nearly USD 40.46 billion.
The market is projected to grow at a CAGR of 5.30% between 2025 and 2034.
The market is estimated to witness a healthy growth in the forecast period of 2025-2034 to reach USD 64.41 billion by 2034.
The major drivers of the beverage cans market include the demand for highly portable and superior packaging solutions, growing household income, popularity of fruit juices and sports drinks, increasing health consciousness among consumers, and increased interest towards maintaining a healthy diet.
The growing consumption of Ready-to-Drink (RTD) beverages and the rising consumption of non-alcoholic products are the key trends propelling the growth of the market.
The major players in the industry are Ball Corporation, Crown Holdings, Inc., GZI Industries Limited, CPMC Holdings Limited, Ardagh Group S.A, Nampak Ltd., and Ceylon Beverage Can (Pvt) Ltd, among others.
Beverage cans have bodies made of either aluminium or steel.
The only beverage container that is infinitely recyclable is made of aluminium. Aluminium cans are lightweight, stackable, and incredibly efficient to freight and store.
The primary applications of beverage cans are alcoholic beverages, carbonated drinks, and fruit and vegetable juices, among others.
Datasheet
One User
USD 2,499
USD 2,249
tax inclusive*
Single User License
One User
USD 3,999
USD 3,599
tax inclusive*
Five User License
Five User
USD 4,999
USD 4,249
tax inclusive*
Corporate License
Unlimited Users
USD 5,999
USD 5,099
tax inclusive*
*Please note that the prices mentioned below are starting prices for each bundle type. Kindly contact our team for further details.*
Flash Bundle
Small Business Bundle
Growth Bundle
Enterprise Bundle
*Please note that the prices mentioned below are starting prices for each bundle type. Kindly contact our team for further details.*
Flash Bundle
Number of Reports: 3
20%
tax inclusive*
Small Business Bundle
Number of Reports: 5
25%
tax inclusive*
Growth Bundle
Number of Reports: 8
30%
tax inclusive*
Enterprise Bundle
Number of Reports: 10
35%
tax inclusive*
How To Order
Our step-by-step guide will help you select, purchase, and access your reports swiftly, ensuring you get the information that drives your decisions, right when you need it.

Select License Type
Choose the right license for your needs and access rights.

Click on ‘Buy Now’
Add the report to your cart with one click and proceed to register.

Select Mode of Payment
Choose a payment option for a secure checkout. You will be redirected accordingly.
Gain insights to stay ahead and seize opportunities.

Get insights & trends for a competitive edge.

Track prices with detailed trend reports.

Analyse trade data for supply chain insights.

Leverage cost reports for smart savings

Enhance supply chain with partnerships.

Connect For More Information
Our expert team of analysts will offer full support and resolve any queries regarding the report, before and after the purchase.
Our expert team of analysts will offer full support and resolve any queries regarding the report, before and after the purchase.
We employ meticulous research methods, blending advanced analytics and expert insights to deliver accurate, actionable industry intelligence, staying ahead of competitors.
Our skilled analysts offer unparalleled competitive advantage with detailed insights on current and emerging markets, ensuring your strategic edge.
We offer an in-depth yet simplified presentation of industry insights and analysis to meet your specific requirements effectively.
Australia
63 Fiona Drive, Tamworth, NSW
+61-448-061-727
India
C130 Sector 2 Noida, Uttar Pradesh 201301
+91-723-689-1189
Philippines
40th Floor, PBCom Tower, 6795 Ayala Avenue Cor V.A Rufino St. Makati City,1226.
+63-287-899-028, +63-967-048-3306
United Kingdom
6 Gardner Place, Becketts Close, Feltham TW14 0BX, Greater London
+44-753-713-2163
United States
30 North Gould Street, Sheridan, WY 82801
+1-415-325-5166
Vietnam
193/26/4 St.no.6, Ward Binh Hung Hoa, Binh Tan District, Ho Chi Minh City
+84-865-399-124
United States (Head Office)
30 North Gould Street, Sheridan, WY 82801
+1-415-325-5166
Australia
63 Fiona Drive, Tamworth, NSW
+61-448-061-727
India
C130 Sector 2 Noida, Uttar Pradesh 201301
+91-723-689-1189
Philippines
40th Floor, PBCom Tower, 6795 Ayala Avenue Cor V.A Rufino St. Makati City, 1226.
+63-287-899-028, +63-967-048-3306
United Kingdom
6 Gardner Place, Becketts Close, Feltham TW14 0BX, Greater London
+44-753-713-2163
Vietnam
193/26/4 St.no.6, Ward Binh Hung Hoa, Binh Tan District, Ho Chi Minh City
+84-865-399-124


Share