Consumer Insights
Uncover trends and behaviors shaping consumer choices today
Procurement Insights
Optimize your sourcing strategy with key market data
Industry Stats
Stay ahead with the latest trends and market analysis.
Trending Now


Base Year
Historical Year
Forecast Year


The global automatic tube cleaning system market value is expected to grow at a CAGR of 4.5% in the forecast period of 2025-2034.
| Global Automatic Tube Cleaning System Market Report Summary | Description | Value |
| Base Year | USD Million | 2023 |
| Historical Period | USD Million | 2018-2024 |
| Forecast Period | USD Million | 2025-2034 |
| Market Size 2024 | USD Million | XX |
| Market Size 2034 | USD Million | XX |
| CAGR 2018-2024 | Percentage | XX% |
| CAGR 2025-2034 | Percentage | 4.5% |
| CAGR 2025-2034 - Market by Region | Asia Pacific | 5.2% |
| CAGR 2025-2034 - Market by Country | India | 5.3% |
| CAGR 2025-2034 - Market by Country | Brazil | 5.0% |
| CAGR 2025-2034 - Market by Type | Automatic Ball Tube Cleaning System | 4.9% |
| CAGR 2025-2034 - Market by Application | Chiller | 5.1% |
| Market Share by Country 2023 | Italy | 2.4% |

Read more about this report - REQUEST FREE SAMPLE COPY IN PDF
An automated tube cleaning system is a type of system that is used for the cleaning and maintenance of tubes within heat exchangers, offering financial savings, easy maintenance, and energy efficiency. Automated tube cleaning systems utilise hydro-mechanical cleaning methods that make heat exchanger surfaces completely free of fouling to maintain their effectiveness.
New power plants are likely to be built in response to rising energy demand, which is predicted to drive up demand for automatic tube cleaning systems in the power generation industry. Automatic tube cleaning systems improve operational efficiencies in power generation, thereby augmenting the demand for the automatic tube cleaning system market.
The key automatic tube cleaning system market dynamics and trends include the increasing use of these systems in heating, ventilation, and other applications to increase operational effectiveness and the rising demand for these systems from various industries, including, power generation, oil and gas, and hospitality sectors, among others.
In the future, the automatic tube cleaning systems industry growth is anticipated to see profitable prospects driven by ongoing desalination projects and advancements in technology that focus on creating cost-effective automated cleaning solutions.
According to the U.S. Energy Information Administration (EIA), U.S. electricity generation from natural gas was approximately 1,700 billion kilowatt-hours (kWh) in 2021. This figure increased slightly to about 1,800 billion kWh in 2022. Renewable energy sources contributed around 800 billion kWh in 2021 and grew to nearly 900 billion kWh in 2022. Nuclear energy production remained stable at around 800 billion kWh for both years. Overall, total U.S. electricity generation remained close to 4,000 billion kWh annually.
According to the International Energy Agency (IEA), in 2022, the European Union saw the largest year-on-year increase in average power generation costs at about 45%. India experienced nearly a 30% increase, while South Korea and Japan both saw a rise of about 25%. Power generation costs in China rose by approximately 20%, with Mexico seeing a similar increase of around 18%. These rises have further boosted the automatic tube cleaning systems industry revenue, as regular and effective cleaning prevents corrosion and damage, extending the life of crucial components and reducing the need for frequent replacements.
According to the BP Statistical Review of World Energy, electricity generation in the Asia-Pacific region reached 13,444.7 terawatt-hours (TWh) in 2021. China was the dominant producer with 8,534.2 TWh, making up about 63.5% of the region's total. India generated 1,579.6 TWh, representing 11.7% of the regional total and showing a decade-long growth rate of 5.3% per year. Japan contributed 1,027.9 TWh, accounting for 7.6% of the region's electricity. South Korea's output was 609.6 TWh, which is 4.5% of the regional total, with an annual growth rate of 2.5% over the past decade. Australia's electricity generation reached 252.7 TWh, accounting for 1.9% of the total, with a consistent annual growth rate of 0.8%. This growth is contributing to the automatic tube cleaning systems market revenue, as stricter emissions and efficiency regulations are driving power generation facilities to implement technologies that enhance performance and reduce environmental impact.

Read more about this report - REQUEST FREE SAMPLE COPY IN PDF
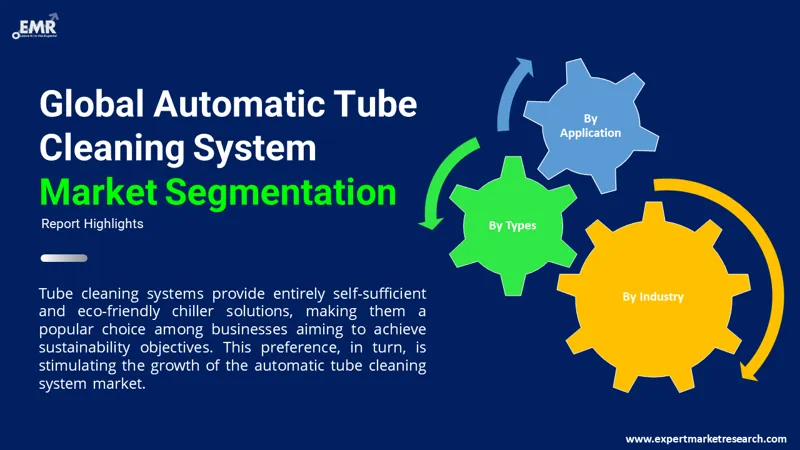
“Global Automatic Tube Cleaning System Market Report and Forecast 2025-2034” offers a detailed analysis of the market based on the following segments:
Market Breakup by Type
Market Breakup by Application
Market Breakup by Industry
Market Breakup by Region
| CAGR 2025-2034 - Market by | Country |
| India | 5.3% |
| Brazil | 5.0% |
| Saudi Arabia | 4.9% |
| China | 4.9% |
| Canada | 4.7% |
| USA | XX% |
| UK | 4.4% |
| France | XX% |
| Italy | XX% |
| Japan | XX% |
| Australia | XX% |
| Mexico | XX% |
| Germany | 4.0% |
In the power generation sector, there is a significant demand for automatic tube cleaning systems market due to their use in cleaning tubes within boilers, turbines, and heat exchangers. This application is driving the growth of the segment within the market. These systems can aid in reducing corrosion and the microbial development that might result from not cleaning regularly, aiding the automatic tube cleaning system market growth.
The oil and gas industry is expected to witness significant growth in the automatic tube cleaning systems industry during the forecast period. In the oil and gas industry, automatic tube cleaning systems aid in cleaning out the tubes of dirt, debris, and other materials.
The companies produce industrial products designed to enhance indoor air quality, energy efficiency, and comfort. Their offerings also include solutions for transporting and preserving food and perishables, as well as improving industrial productivity and efficiency.
| REPORT FEATURES | DETAILS |
| Base Year | 2023 |
| Historical Period | 2018-2024 |
| Forecast Period | 2025-2034 |
| Scope of the Report |
Historical and Forecast Trends, Industry Drivers and Constraints, Historical and Forecast Market Analysis by Segment:
|
| Breakup by Type |
|
| Breakup by Application |
|
| Breakup by Industry |
|
| Breakup by Region |
|
| Market Dynamics |
|
| Competitive Landscape |
|
| Companies Covered |
|
| Report Price and Purchase Option | Explore our purchase options that are best suited to your resources and industry needs. |
| Delivery Format | Delivered as an attached PDF and Excel through email, with an option of receiving an editable PPT, according to the purchase option. |
Automatic Tube Cleaning System Market Size
Automatic Tube Cleaning System Market Growth
Automatic Tube Cleaning System Market Analysis
*While we strive to always give you current and accurate information, the numbers depicted on the website are indicative and may differ from the actual numbers in the main report. At Expert Market Research, we aim to bring you the latest insights and trends in the market. Using our analyses and forecasts, stakeholders can understand the market dynamics, navigate challenges, and capitalize on opportunities to make data-driven strategic decisions.*
Get in touch with us for a customized solution tailored to your unique requirements and save upto 35%!
The automatic tube cleaning system market value is projected to grow at a CAGR of 4.5% between 2025 and 2034.
The major market drivers include the surging awareness regarding the benefits of ACCS systems and rising environmental concerns owing to rapid climate change.
The key trends guiding the growth of the market include the increasing use of automatic tube cleaners in HVAC systems and the surging use of automatic tube cleaning systems in water-based cooling solutions.
The market is broken down into North America, Europe, Asia Pacific, Latin America, the Middle East, and Africa.
The significant types of automatic tube cleaning systems in the market are automatic ball tube cleaning systems and automatic brush tube cleaning systems.
The various applications of automatic tube cleaning systems in the market include condensers, chillers, and boilers, among others.
The different industries in the market for automatic tube cleaning systems are power generation, oil and gas, commercial space, and hospitality, among others.
The competitive landscape consists of Trane Technologies plc, Innovas Technologies, LLC, Ovivo, Inc., AHI Carrier FZC (AHIC), WSA Engineered Systems, and CET Enviro Pvt Ltd, among others.
Datasheet
One User
USD 2,499
USD 2,249
tax inclusive*
Single User License
One User
USD 3,999
USD 3,599
tax inclusive*
Five User License
Five User
USD 4,999
USD 4,249
tax inclusive*
Corporate License
Unlimited Users
USD 5,999
USD 5,099
tax inclusive*
*Please note that the prices mentioned below are starting prices for each bundle type. Kindly contact our team for further details.*
Flash Bundle
Small Business Bundle
Growth Bundle
Enterprise Bundle
*Please note that the prices mentioned below are starting prices for each bundle type. Kindly contact our team for further details.*
Flash Bundle
Number of Reports: 3
20%
tax inclusive*
Small Business Bundle
Number of Reports: 5
25%
tax inclusive*
Growth Bundle
Number of Reports: 8
30%
tax inclusive*
Enterprise Bundle
Number of Reports: 10
35%
tax inclusive*
How To Order
Our step-by-step guide will help you select, purchase, and access your reports swiftly, ensuring you get the information that drives your decisions, right when you need it.

Select License Type
Choose the right license for your needs and access rights.

Click on ‘Buy Now’
Add the report to your cart with one click and proceed to register.

Select Mode of Payment
Choose a payment option for a secure checkout. You will be redirected accordingly.
Track prices with detailed trend reports.

Analyse trade data for supply chain insights.

Leverage cost reports for smart savings

Enhance supply chain with partnerships.

Gain insights to stay ahead and seize opportunities.

Get insights & trends for a competitive edge.

Track prices with detailed trend reports.

Analyse trade data for supply chain insights.

Leverage cost reports for smart savings

Enhance supply chain with partnerships.

Gain insights to stay ahead and seize opportunities.

Get insights & trends for a competitive edge.

Track prices with detailed trend reports.

Analyse trade data for supply chain insights.

Connect For More Information
Our expert team of analysts will offer full support and resolve any queries regarding the report, before and after the purchase.
Our expert team of analysts will offer full support and resolve any queries regarding the report, before and after the purchase.
We employ meticulous research methods, blending advanced analytics and expert insights to deliver accurate, actionable industry intelligence, staying ahead of competitors.
Our skilled analysts offer unparalleled competitive advantage with detailed insights on current and emerging markets, ensuring your strategic edge.
We offer an in-depth yet simplified presentation of industry insights and analysis to meet your specific requirements effectively.


Australia
63 Fiona Drive, Tamworth, NSW
+61-448-061-727
India
C130 Sector 2 Noida, Uttar Pradesh 201301
+91-723-689-1189
Philippines
40th Floor, PBCom Tower, 6795 Ayala Avenue Cor V.A Rufino St. Makati City,1226.
+63-287-899-028, +63-967-048-3306
United Kingdom
6 Gardner Place, Becketts Close, Feltham TW14 0BX, Greater London
+44-753-713-2163
United States
30 North Gould Street, Sheridan, WY 82801
+1-415-325-5166
Vietnam
193/26/4 St.no.6, Ward Binh Hung Hoa, Binh Tan District, Ho Chi Minh City
+84-865-399-124
United States (Head Office)
30 North Gould Street, Sheridan, WY 82801
+1-415-325-5166
Australia
63 Fiona Drive, Tamworth, NSW
+61-448-061-727
India
C130 Sector 2 Noida, Uttar Pradesh 201301
+91-723-689-1189
Philippines
40th Floor, PBCom Tower, 6795 Ayala Avenue Cor V.A Rufino St. Makati City, 1226.
+63-287-899-028, +63-967-048-3306
United Kingdom
6 Gardner Place, Becketts Close, Feltham TW14 0BX, Greater London
+44-753-713-2163
Vietnam
193/26/4 St.no.6, Ward Binh Hung Hoa, Binh Tan District, Ho Chi Minh City
+84-865-399-124
Share