

Consumer Insights
Uncover trends and behaviors shaping consumer choices today
Procurement Insights
Optimize your sourcing strategy with key market data
Industry Stats
Stay ahead with the latest trends and market analysis.

The automated guided vehicle market reached a value of about USD 2.92 Billion in 2025. The market is projected to grow at a CAGR of 9.80% between 2026 and 2035 to reach nearly USD 7.44 Billion by 2035.
Base Year
Historical Period
Forecast Period
With the robust growth of the e-commerce sector and increasing order volume, the use of AGVs in warehouses and distribution centres for order sorting, picking, and transporting goods is rising. In Q3 2024, US retail e-commerce sales were USD 300.1 billion, an increase of 2.6% from the previous quarter. As e-commerce platforms are focusing on meeting the growing demand for faster delivery options, AGVs, especially automated delivery vehicles and autonomous delivery robots, are increasingly explored for use in suburban and urban deliveries.
5G networks, due to their low latency and fast data transfer speed, enable AGVs operating in complex environments to efficiently communicate with central control systems. In 2023, nearly 40% of all wireless devices boasted a 5G connection in the United States. In the forecast period, the development of 5G-equipped AGVs that can instantaneously react to environmental stimuli, reduce the risk of collisions, and improve safety is expected to create lucrative automated guided vehicle market opportunities.
AGVs connected to cloud platforms are increasingly gaining momentum as they enable better fleet optimisation, provide valuable insights into route efficiency, vehicle performance, and operational bottlenecks, and facilitate predictive maintenance. Hence, the growing focus of businesses to improve productivity, drive cost-efficiency, and enhance safety is driving the demand for cloud-connected AGVs.
Compound Annual Growth Rate
9.8%
Value in USD Billion
2026-2035
*this image is indicative*
| Global Automated Guided Vehicle Market Report Summary | Description | Value |
| Base Year |
USD Billion |
2025 |
| Historical Period |
USD Billion |
2019-2025 |
| Forecast Period |
USD Billion |
2026-2035 |
| Market Size 2025 |
USD Billion |
2.92 |
| Market Size 2035 |
USD Billion |
7.44 |
| CAGR 2019-2025 | Percentage | XX% |
| CAGR 2026-2035 | Percentage | 9.80% |
| CAGR 2026-2035 - Market by Region | Asia Pacific | 11.3% |
| CAGR 2026-2035 - Market by Country | India | 13.0% |
| CAGR 2026-2035 - Market by Country | China | 10.8% |
| CAGR 2026-2035 - Market by Navigation Technology | Vision Guidance | 11.2% |
| CAGR 2026-2035 - Market by End Use | Manufacturing Sector | 13.7% |
| Market Share by Country 2025 | Japan | 4.3% |
Based on type, the unit load carrier segment accounts for a significant share in the automated guided vehicle industry. This can be attributed to the increasing utilisation of unit load carriers to deliver pallets and large containers and their ability to schedule the task efficiently by minimising product damage and aisle traffic. Further, they do not need human intervention unlike fork trucks, and, thus, are great for repetitive tasks and hazardous areas. Being autonomous in nature, they reduce the requirement of human labour and provide enhanced safety to workers. The rising demand for enhanced workers’ safety is significantly contributing to the growth of the segment.


Increasing trend of Industry 4.0; technological advancements; rising focus on safety; and growing trend of sustainability are favouring the automated guided vehicle market expansion.
The growing trend of Industry 4.0 is surging the demand for automated guided vehicles (AGVs) to efficiently transport materials, goods, and equipment, streamline internal logistics processes, and eliminate the need for manual labour. In Industry 4.0 environments, AGVs are increasingly connected to centralised systems to enable data collection on battery life, route performance, and task completion.
The integration of advanced technologies such as machine learning (ML) and artificial intelligence (AI) is revolutionising the automated guided vehicle market landscape. AI and ML enable AGVs to analyse vast amounts of sensor data, extract meaningful insights, support decision-making processes, optimise navigation paths, and facilitate predictive maintenance.
Safety has emerged as a key concern in logistics and warehousing operations, surging the demand for automated guided vehicles equipped with advanced safety features like 360-degree cameras, LiDAR, laser scanners, and ultrasonic sensors to detect pedestrians, obstacles, and hazardous conditions in real-time, hence preventing collisions and accidents in dynamic environments.
With sustainability becoming a priority in almost all sectors, including logistics, key players are developing AGV designs powered by sustainable energy sources and energy-efficient lithium-ion batteries to align with eco-friendly logistics processes. They are also utilising sustainable and recyclable materials in the manufacturing of automated guided vehicles to reduce their environmental footprint.
Region-wise, the Asia Pacific is expected to witness a robust growth over the forecast period owing to the increasing acceptance of technology, rapid industrialisation, and growing shift towards automation. Furthermore, the growing investments by the leading e-commerce companies like Amazon and others in emerging countries like China and India are expected to significantly contribute to the industry growth in the forecast period.
Read more about this report - REQUEST FREE SAMPLE COPY IN PDF
Automated guided vehicles (AGV) refer to load carriers or material handling systems that are autonomous in nature. They are programmed to travel autonomously across manufacturing facilities, warehouses, or distribution centres to assist in moving and transporting items. AGVs provide significant advantages like increase in precision and productivity, safety inside facilities, and reduction in labour cost.
By type, the market is divided into:
Based on navigation technology, the industry can be segmented into:
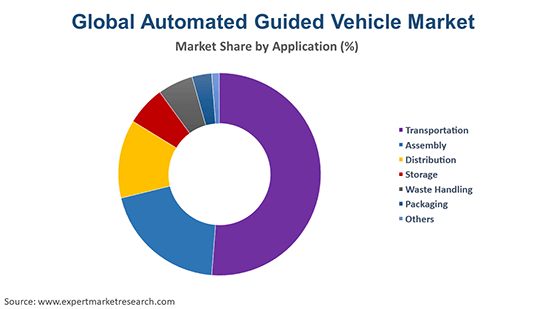
The market is divided based on application into:
On the basis of end use, the industry can be bifurcated into:
By industry, the market can be segmented into:
The regional markets for the product include:
In recent years, supply chain management has witnessed a dramatic shift towards automation. There has been a rise in adoption of automated guided vehicles like forklifts, pallet trucks, small rack-carrying robots, and others as these vehicles can perform some tasks by using machine learning and deep learning. They are seen as the safest alternatives for manual material handling. Additionally, the growth of the e-commerce industry is resulting in increased demand for safe and efficient material handling equipment to boost productivity. This is further driving the growth of the automated guided vehicle industry. However, high initial investment and maintenance costs associated with automated guided vehicles may hamper the industry growth.
Over the forecast period, the rapid technological advancements and the increasing focus on safety and accuracy are expected to favour the industry growth. The integration of industry 4.0 is expected to be a major trend in the coming years.
| CAGR 2026-2035 - Market by | Country |
| India | 13.0% |
| China | 10.8% |
| USA | 8.7% |
| Germany | 8.1% |
| Australia | 7.7% |
| Canada | XX% |
| UK | XX% |
| France | XX% |
| Italy | 6.9% |
| Japan | XX% |
| Saudi Arabia | XX% |
| Brazil | XX% |
| Mexico | XX% |
Key automated guided vehicle market players are focusing on technological advancements and integrating technologies such as AI, machine learning, and robots to improve the precision, autonomy, and decision-making of AGVs. Automated guided vehicle companies are also offering customised AGV solutions that can be tailored for diverse applications, including assembly line transportation, material handling, and order picking, among others.
Daifuku Co. Ltd., headquartered in Osaka, Japan, and founded in 1937, is a company that is engaged in engineering, consulting, designing, manufacturing, and installing material handling equipment and logistics systems. It has operations in 24 countries across the globe. By 2030, the company aims to achieve consolidated sales of JPY 1 trillion as well as an operating margin of 12.5%.
Seegrid Corporation, founded in 2003 and headquartered in Pennsylvania, United States, is a company that offers autonomous mobile robot (AMR) solutions for use in material handling solutions. It has partnered with over 50 global brands and more than 2,000 of its AMR solutions have been deployed within over 200 customer sites.
KUKA AG, headquartered in Augsburg, Germany, and founded in 1898, is a global automation company and one of the leading suppliers of intelligent automation solutions. It offers products, solutions, and services such as autonomous mobile robots (AMR), industrial robots, cloud-based digital services, and fully connected production systems for use in sectors like automotive, e-commerce, consumer goods, retail, and healthcare. The company is active in over 50 countries and boasts more than 100 locations.
Oceaneering International, Inc., founded in 1969 and headquartered in Texas, United States, is a prominent technology company that delivers robotic solutions and engineering products and services to sectors such as defence, offshore energy, manufacturing, and aerospace, among others.
*Please note that this is only a partial list; the complete list of key players is available in the full report. Additionally, the list of key players can be customized to better suit your needs.*
Other leading companies in the automated guided vehicle market include JBT Europe B.V., and Toyota Material Handling, Inc., among others.


Upto 15% Off
USD
$2499 $2249
$3999 $3599
$4999 $4249
$5999 $5099


*While we strive to always give you current and accurate information, the numbers depicted on the website are indicative and may differ from the actual numbers in the main report. At Expert Market Research, we aim to bring you the latest insights and trends in the market. Using our analyses and forecasts, stakeholders can understand the market dynamics, navigate challenges, and capitalize on opportunities to make data-driven strategic decisions.*
Get in touch with us for a customized solution tailored to your unique requirements and save upto 35%!
In 2025, the market attained a value of approximately USD 2.92 Billion.
The market is projected to grow at a CAGR of 9.80% between 2026 and 2035.
The market is estimated to witness a healthy growth in the forecast period of 2026-2035 to reach about USD 7.44 Billion by 2035.
The major drivers of the market include the increasing shift towards automation in material handling, rising demand for enhanced safety, and the growing e-commerce market.
The key trends guiding the growth of the market include the growing technological advancements and the increasing focus on accuracy and precision.
The major regions in the market are North America, Latin America, the Middle East and Africa, Europe, and the Asia Pacific.
The leading types of automated guided vehicle in the market are unit load carriers, tow vehicles, assembly line vehicles, forklift vehicles, pallet trucks, and special purpose, among others.
The major navigation technologies of the market are vision guidance, laser guidance, inductive guidance, magnetic guidance, and optical tape guidance, among others.
The significant applications in the market are transportation, assembly, distribution, storage, waste handling, and packaging, among others.
The leading end uses in the market are manufacturing sector and wholesale and distribution sector.
The major industries in the market are automotive, metal and heavy machinery, logistics, chemical, aviation, food and beverage, electrical and electronics, and retail, among others.
The key players in the global automated guided vehicle market are Daifuku Co., Ltd., JBT Europe B.V., KUKA AG, Seegrid Corporation, Toyota Material Handling, Inc., and Oceaneering International, Inc., among others.
Explore our key highlights of the report and gain a concise overview of key findings, trends, and actionable insights that will empower your strategic decisions.
| REPORT FEATURES | DETAILS |
| Base Year | 2025 |
| Historical Period | 2019-2025 |
| Forecast Period | 2026-2035 |
| Scope of the Report |
Historical and Forecast Trends, Industry Drivers and Constraints, Historical and Forecast Market Analysis by Segment:
|
| Breakup by Type |
|
| Breakup by Navigation Technology |
|
| Breakup by Application |
|
| Breakup by End Use |
|
| Breakup by Industry |
|
| Breakup by Region |
|
| Market Dynamics |
|
| Competitive Landscape |
|
| Companies Covered |
|
| Report Price and Purchase Option | Explore our purchase options that are best suited to your resources and industry needs. |
| Delivery Format | Delivered as an attached PDF and Excel through email, with an option of receiving an editable PPT, according to the purchase option. |
Datasheet
One User
USD 2,499
USD 2,249
tax inclusive*
Single User License
One User
USD 3,999
USD 3,599
tax inclusive*
Five User License
Five User
USD 4,999
USD 4,249
tax inclusive*
Corporate License
Unlimited Users
USD 5,999
USD 5,099
tax inclusive*
*Please note that the prices mentioned below are starting prices for each bundle type. Kindly contact our team for further details.*
Flash Bundle
Small Business Bundle
Growth Bundle
Enterprise Bundle
*Please note that the prices mentioned below are starting prices for each bundle type. Kindly contact our team for further details.*
Flash Bundle
Number of Reports: 3
20%
tax inclusive*
Small Business Bundle
Number of Reports: 5
25%
tax inclusive*
Growth Bundle
Number of Reports: 8
30%
tax inclusive*
Enterprise Bundle
Number of Reports: 10
35%
tax inclusive*
How To Order

Select License Type
Choose the right license for your needs and access rights.

Click on ‘Buy Now’
Add the report to your cart with one click and proceed to register.

Select Mode of Payment
Choose a payment option for a secure checkout. You will be redirected accordingly.
Gain insights to stay ahead and seize opportunities.

Get insights & trends for a competitive edge.

Track prices with detailed trend reports.

Analyse trade data for supply chain insights.

Leverage cost reports for smart savings

Enhance supply chain with partnerships.

Connect For More Information
Our expert team of analysts will offer full support and resolve any queries regarding the report, before and after the purchase.
Our expert team of analysts will offer full support and resolve any queries regarding the report, before and after the purchase.
We employ meticulous research methods, blending advanced analytics and expert insights to deliver accurate, actionable industry intelligence, staying ahead of competitors.
Our skilled analysts offer unparalleled competitive advantage with detailed insights on current and emerging markets, ensuring your strategic edge.
We offer an in-depth yet simplified presentation of industry insights and analysis to meet your specific requirements effectively.


Share